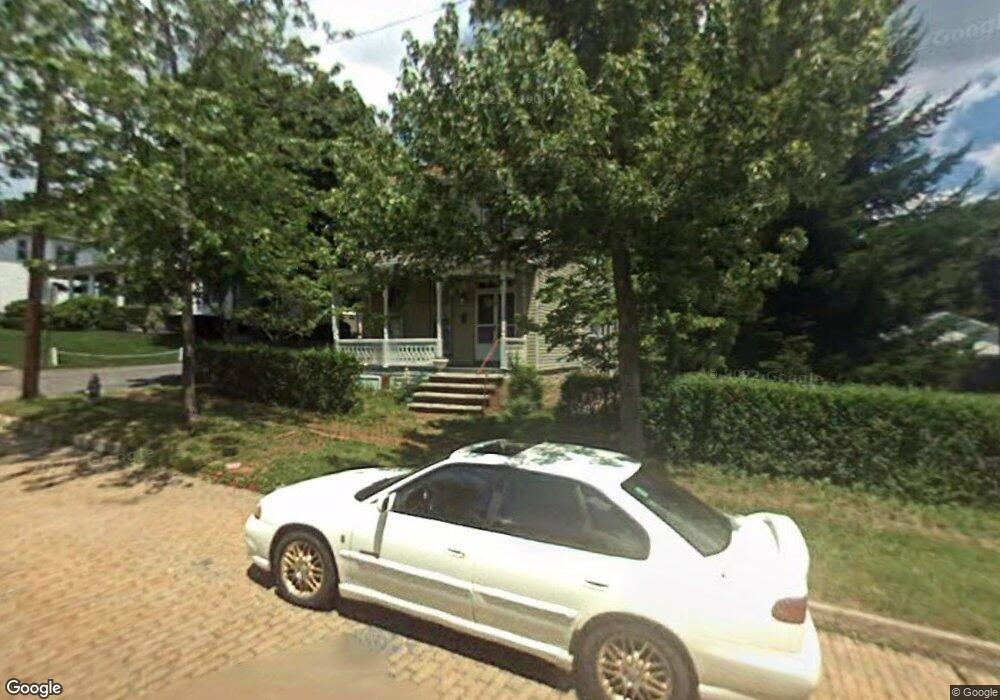
67 Frost Ave Frostburg, MD 21532
Estimated Value: $109,332 - $145,000
--
Bed
1
Bath
1,602
Sq Ft
$77/Sq Ft
Est. Value
About This Home
This home is located at 67 Frost Ave, Frostburg, MD 21532 and is currently estimated at $124,083, approximately $77 per square foot. 67 Frost Ave is a home located in Allegany County with nearby schools including Beall Elementary School, Mount Savage Middle School, and Mountain Ridge High School.
Ownership History
Date
Name
Owned For
Owner Type
Purchase Details
Closed on
Apr 23, 1992
Sold by
Darr Joseph W
Bought by
Derosa Norman A-Patricia A
Current Estimated Value
Home Financials for this Owner
Home Financials are based on the most recent Mortgage that was taken out on this home.
Original Mortgage
$58,000
Interest Rate
8.76%
Purchase Details
Closed on
Mar 24, 1987
Sold by
Determan A William
Bought by
Darr Joseph W
Home Financials for this Owner
Home Financials are based on the most recent Mortgage that was taken out on this home.
Original Mortgage
$48,000
Interest Rate
9.03%
Create a Home Valuation Report for This Property
The Home Valuation Report is an in-depth analysis detailing your home's value as well as a comparison with similar homes in the area
Home Values in the Area
Average Home Value in this Area
Purchase History
| Date | Buyer | Sale Price | Title Company |
|---|---|---|---|
| Derosa Norman A-Patricia A | $58,000 | -- | |
| Darr Joseph W | $48,000 | -- |
Source: Public Records
Mortgage History
| Date | Status | Borrower | Loan Amount |
|---|---|---|---|
| Closed | Derosa Norman A-Patricia A | $58,000 | |
| Previous Owner | Darr Joseph W | $48,000 |
Source: Public Records
Tax History Compared to Growth
Tax History
| Year | Tax Paid | Tax Assessment Tax Assessment Total Assessment is a certain percentage of the fair market value that is determined by local assessors to be the total taxable value of land and additions on the property. | Land | Improvement |
|---|---|---|---|---|
| 2025 | $830 | $85,200 | $27,200 | $58,000 |
| 2024 | $809 | $80,867 | $0 | $0 |
| 2023 | $761 | $76,533 | $0 | $0 |
| 2022 | $730 | $72,200 | $27,200 | $45,000 |
| 2021 | $729 | $71,667 | $0 | $0 |
| 2020 | $698 | $71,133 | $0 | $0 |
| 2019 | $699 | $70,600 | $27,200 | $43,400 |
| 2018 | $708 | $70,600 | $27,200 | $43,400 |
| 2017 | $702 | $70,600 | $0 | $0 |
| 2016 | -- | $81,500 | $0 | $0 |
| 2015 | $798 | $81,500 | $0 | $0 |
| 2014 | $798 | $81,500 | $0 | $0 |
Source: Public Records
Map
Nearby Homes