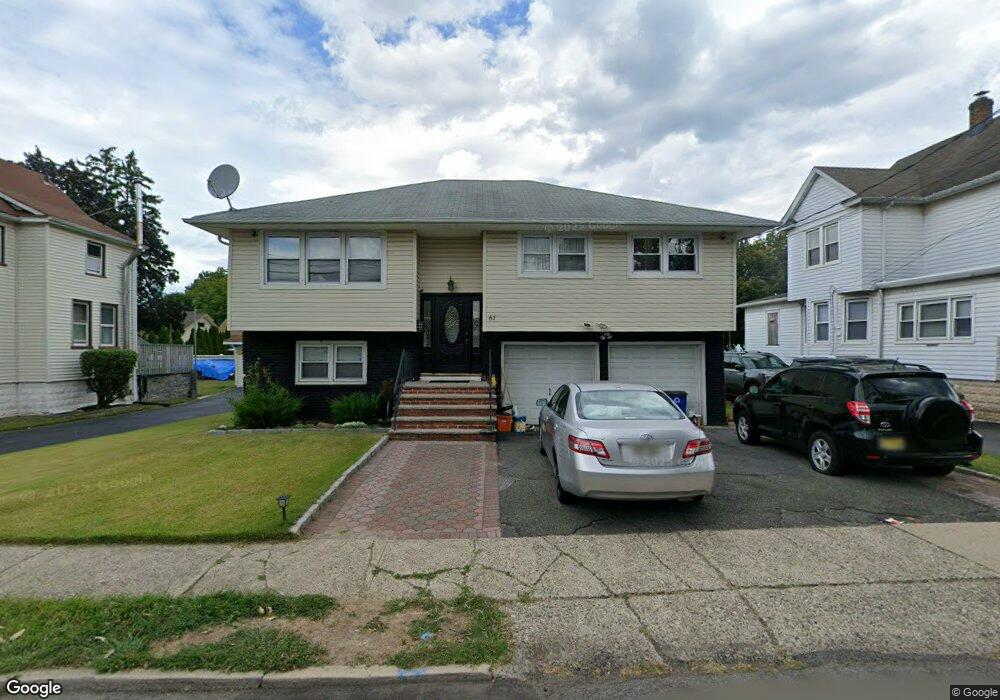
67 Gray St Bogota, NJ 07603
Estimated Value: $609,000 - $733,000
--
Bed
--
Bath
2,322
Sq Ft
$295/Sq Ft
Est. Value
About This Home
This home is located at 67 Gray St, Bogota, NJ 07603 and is currently estimated at $684,227, approximately $294 per square foot. 67 Gray St is a home located in Bergen County with nearby schools including Bogota Junior/Senior High School, Teaneck Community Charter School, and Bogota Middle School.
Ownership History
Date
Name
Owned For
Owner Type
Purchase Details
Closed on
Feb 19, 2021
Sold by
Almanasir Rania and Estate Of Issam Kahlod Kanawi
Bought by
Almanasir Rania
Current Estimated Value
Purchase Details
Closed on
Jul 31, 2000
Sold by
Decandia Morris and Decandia Jeanne
Bought by
Kanawi Issam
Home Financials for this Owner
Home Financials are based on the most recent Mortgage that was taken out on this home.
Original Mortgage
$150,000
Interest Rate
7.88%
Mortgage Type
Stand Alone First
Create a Home Valuation Report for This Property
The Home Valuation Report is an in-depth analysis detailing your home's value as well as a comparison with similar homes in the area
Home Values in the Area
Average Home Value in this Area
Purchase History
| Date | Buyer | Sale Price | Title Company |
|---|---|---|---|
| Almanasir Rania | -- | Fortuna Title Llc | |
| Kanawi Issam | $250,000 | Chicago Title Insurance Co |
Source: Public Records
Mortgage History
| Date | Status | Borrower | Loan Amount |
|---|---|---|---|
| Closed | Kanawi Issam | $150,000 |
Source: Public Records
Tax History Compared to Growth
Tax History
| Year | Tax Paid | Tax Assessment Tax Assessment Total Assessment is a certain percentage of the fair market value that is determined by local assessors to be the total taxable value of land and additions on the property. | Land | Improvement |
|---|---|---|---|---|
| 2025 | $11,543 | $496,700 | $255,000 | $241,700 |
| 2024 | $11,272 | $496,700 | $255,000 | $241,700 |
| 2023 | $11,091 | $262,500 | $140,000 | $122,500 |
| 2022 | $11,091 | $262,500 | $140,000 | $122,500 |
| 2021 | $10,851 | $262,500 | $140,000 | $122,500 |
| 2020 | $10,692 | $262,500 | $140,000 | $122,500 |
| 2019 | $10,547 | $262,500 | $140,000 | $122,500 |
| 2018 | $10,290 | $262,500 | $140,000 | $122,500 |
| 2017 | $9,975 | $262,500 | $140,000 | $122,500 |
| 2016 | $9,904 | $262,500 | $140,000 | $122,500 |
| 2015 | $9,789 | $262,500 | $140,000 | $122,500 |
| 2014 | $9,529 | $262,500 | $140,000 | $122,500 |
Source: Public Records
Map
Nearby Homes