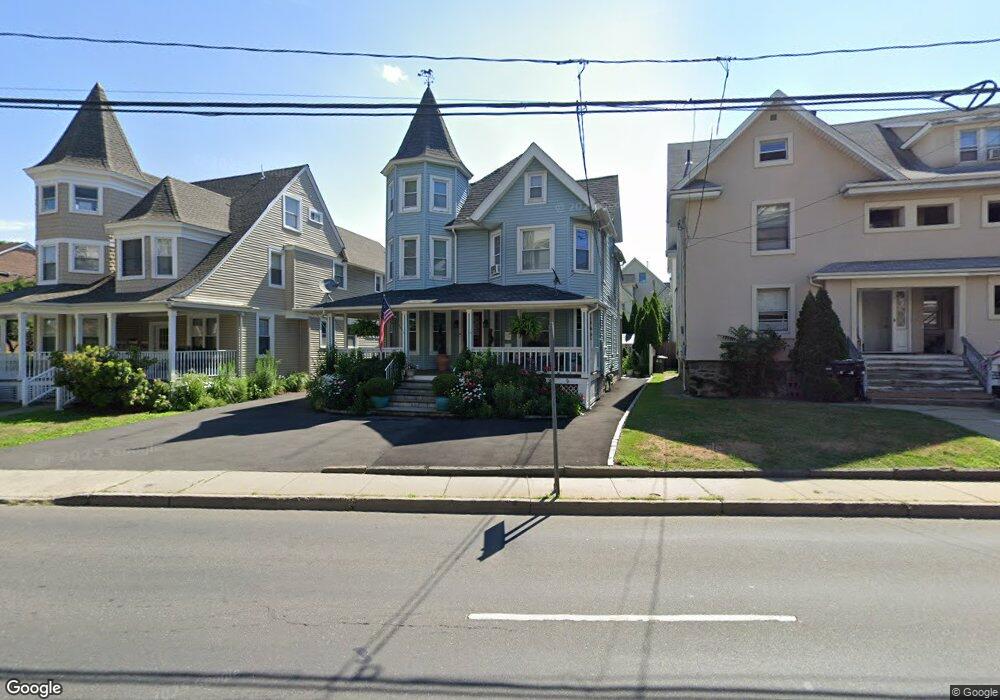
67 Grove St Stamford, CT 06901
Downtown Stamford NeighborhoodEstimated Value: $786,000 - $1,088,000
6
Beds
3
Baths
3,249
Sq Ft
$280/Sq Ft
Est. Value
About This Home
This home is located at 67 Grove St, Stamford, CT 06901 and is currently estimated at $910,890, approximately $280 per square foot. 67 Grove St is a home located in Fairfield County with nearby schools including Stillmeadow Elementary School, Rippowam Middle School, and Stamford High School.
Ownership History
Date
Name
Owned For
Owner Type
Purchase Details
Closed on
Jan 22, 2019
Sold by
Hernandez Zoila R
Bought by
Ospina Luisa F and Rodriguez Javiera A
Current Estimated Value
Home Financials for this Owner
Home Financials are based on the most recent Mortgage that was taken out on this home.
Original Mortgage
$395,505
Outstanding Balance
$347,745
Interest Rate
4.7%
Mortgage Type
Future Advance Clause Open End Mortgage
Estimated Equity
$563,145
Purchase Details
Closed on
Nov 9, 2006
Sold by
Rodriges Gorgonio
Bought by
Orsaia Silvana
Purchase Details
Closed on
Sep 2, 2004
Sold by
Daily Eleanor
Bought by
Hernandez Gilberto and Rodrigos Gorgonio
Purchase Details
Closed on
Jul 28, 1988
Sold by
Hersh Nancy
Bought by
Hurd Karen
Create a Home Valuation Report for This Property
The Home Valuation Report is an in-depth analysis detailing your home's value as well as a comparison with similar homes in the area
Home Values in the Area
Average Home Value in this Area
Purchase History
| Date | Buyer | Sale Price | Title Company |
|---|---|---|---|
| Ospina Luisa F | $135,400 | -- | |
| Ospina Luisa F | $135,400 | -- | |
| Orsaia Silvana | $575,000 | -- | |
| Orsaia Silvana | $575,000 | -- | |
| Hernandez Gilberto | $49,000 | -- | |
| Hernandez Gilberto | $49,000 | -- | |
| Hurd Karen | $150,000 | -- |
Source: Public Records
Mortgage History
| Date | Status | Borrower | Loan Amount |
|---|---|---|---|
| Open | Ospina Luisa F | $395,505 | |
| Closed | Ospina Luisa F | $395,505 | |
| Previous Owner | Hurd Karen | $458,923 | |
| Previous Owner | Hurd Karen | $468,000 |
Source: Public Records
Tax History Compared to Growth
Tax History
| Year | Tax Paid | Tax Assessment Tax Assessment Total Assessment is a certain percentage of the fair market value that is determined by local assessors to be the total taxable value of land and additions on the property. | Land | Improvement |
|---|---|---|---|---|
| 2025 | $11,592 | $484,620 | $195,970 | $288,650 |
| 2024 | $11,321 | $484,620 | $195,970 | $288,650 |
| 2023 | $12,232 | $484,620 | $195,970 | $288,650 |
| 2022 | $9,843 | $362,270 | $144,340 | $217,930 |
| 2021 | $9,760 | $362,270 | $144,340 | $217,930 |
| 2020 | $9,546 | $362,270 | $144,340 | $217,930 |
| 2019 | $9,541 | $362,100 | $144,340 | $217,760 |
| 2018 | $9,244 | $362,100 | $144,340 | $217,760 |
| 2017 | $6,638 | $246,860 | $88,770 | $158,090 |
| 2016 | $6,397 | $244,900 | $88,770 | $156,130 |
| 2015 | $6,228 | $244,900 | $88,770 | $156,130 |
| 2014 | $6,071 | $244,900 | $88,770 | $156,130 |
Source: Public Records
Map
Nearby Homes
- 109 Highland Rd
- 300 Broad St Unit 902
- 18 Highland Rd
- 25 Forest St Unit 11M
- 25 Forest St Unit 8C
- 127 Greyrock Place Unit 607
- 127 Greyrock Place Unit 1503
- 127 Greyrock Place Unit 1112
- 22 Glenbrook Rd Unit 414
- 71 Lindale St
- 77 Lindale St
- 50 Glenbrook Rd Unit 4B
- 50 Glenbrook Rd Unit 9F
- 50 Glenbrook Rd Unit 4B
- 125 Prospect St Unit 2E
- 49 Valley Rd
- 49 Glenbrook Rd Unit 108
- 143 Hoyt St Unit 1A
- 87 Glenbrook Rd Unit 3D
- 87 Glenbrook Rd Unit 3D
- 71 Grove St Unit 2
- 71 Grove St Unit 1
- 71 Grove St Unit 3
- 71 Grove St
- 99 Forest St
- 3 Ridge Place
- 61 Grove St Unit G
- 61 Grove St Unit F
- 61 Grove St Unit E
- 61 Grove St Unit D
- 61 Grove St Unit C
- 61 Grove St Unit B
- 61 Grove St Unit A
- 61 Grove St Unit E
- 61 Grove St Unit A
- 106 Forest St
- 108 Forest St
- 105 Forest St Unit 10
- 105 Forest St Unit 2