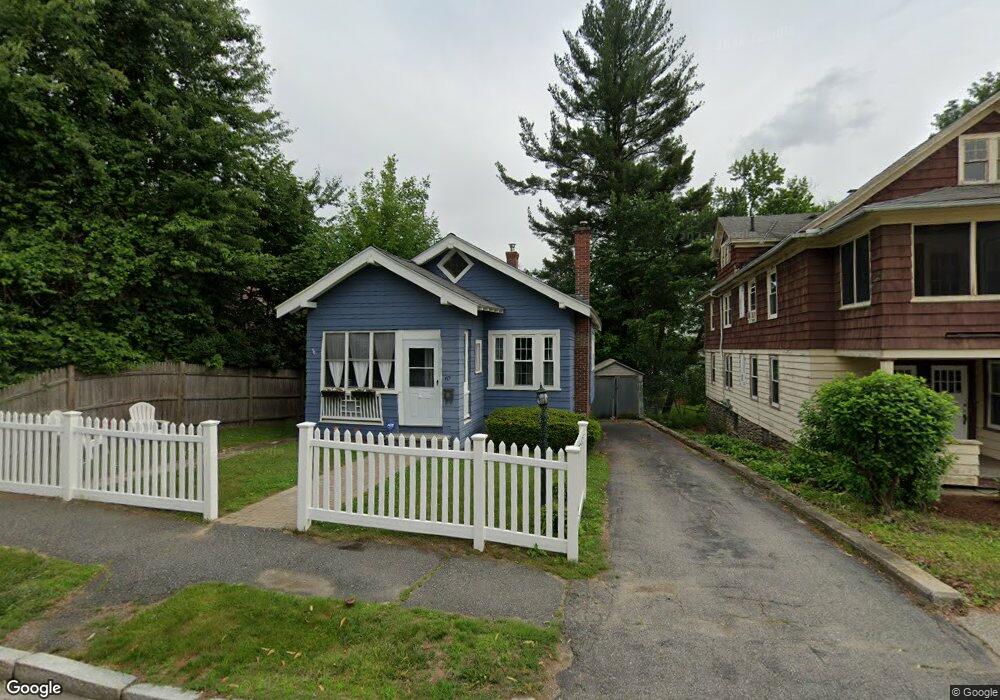
67 Hadwen Rd Worcester, MA 01602
Newton Square NeighborhoodEstimated Value: $290,000 - $372,000
2
Beds
2
Baths
865
Sq Ft
$377/Sq Ft
Est. Value
About This Home
This home is located at 67 Hadwen Rd, Worcester, MA 01602 and is currently estimated at $325,820, approximately $376 per square foot. 67 Hadwen Rd is a home located in Worcester County with nearby schools including Chandler Magnet, Jacob Hiatt Magnet School, and May Street Elementary School.
Ownership History
Date
Name
Owned For
Owner Type
Purchase Details
Closed on
Nov 24, 1998
Sold by
Stcyr Dorothy J
Bought by
Walsh Lisa M
Current Estimated Value
Purchase Details
Closed on
Mar 24, 1995
Sold by
Mutual Builders Inc
Bought by
Young Dorothy M
Purchase Details
Closed on
Mar 2, 1995
Sold by
Coyle Mark A and Coyle Linda
Bought by
Mutual Builders Inc
Purchase Details
Closed on
Nov 30, 1988
Sold by
Steele John J
Bought by
Coyle M A
Create a Home Valuation Report for This Property
The Home Valuation Report is an in-depth analysis detailing your home's value as well as a comparison with similar homes in the area
Home Values in the Area
Average Home Value in this Area
Purchase History
| Date | Buyer | Sale Price | Title Company |
|---|---|---|---|
| Walsh Lisa M | $89,900 | -- | |
| Young Dorothy M | $70,500 | -- | |
| Mutual Builders Inc | $80,000 | -- | |
| Coyle M A | $111,500 | -- |
Source: Public Records
Mortgage History
| Date | Status | Borrower | Loan Amount |
|---|---|---|---|
| Open | Coyle M A | $155,270 | |
| Closed | Coyle M A | $110,000 | |
| Closed | Coyle M A | $10,000 |
Source: Public Records
Tax History Compared to Growth
Tax History
| Year | Tax Paid | Tax Assessment Tax Assessment Total Assessment is a certain percentage of the fair market value that is determined by local assessors to be the total taxable value of land and additions on the property. | Land | Improvement |
|---|---|---|---|---|
| 2025 | $2,622 | $198,800 | $86,500 | $112,300 |
| 2024 | $2,599 | $189,000 | $86,500 | $102,500 |
| 2023 | $2,472 | $172,400 | $75,200 | $97,200 |
| 2022 | $2,236 | $147,000 | $60,200 | $86,800 |
| 2021 | $2,222 | $136,500 | $48,200 | $88,300 |
| 2020 | $2,196 | $129,200 | $48,200 | $81,000 |
| 2019 | $2,162 | $120,100 | $43,400 | $76,700 |
| 2018 | $2,167 | $114,600 | $43,400 | $71,200 |
| 2017 | $2,078 | $108,100 | $43,400 | $64,700 |
| 2016 | $2,065 | $100,200 | $32,700 | $67,500 |
| 2015 | $2,011 | $100,200 | $32,700 | $67,500 |
| 2014 | $1,952 | $99,900 | $32,700 | $67,200 |
Source: Public Records
Map
Nearby Homes
- 24 Hadwen Rd
- 16 Sherwood Rd
- 96 June St Unit 3
- 33 Carlisle St
- 18 Hadwen Ln
- 3 Franconia St
- 336 Lovell St
- 9 Field Way
- 19 Kenilworth Rd
- 6 Newton Ave
- 5 Coombs Rd
- 34 Rosslare Dr Unit 108
- 322 Highland St
- 3 Suburban Rd
- 31 Lenox St
- 7 Longworth Rd
- 47R Yarnie Unit 3B
- 47R Yarnie Unit 3A
- 47R Yarnie Unit 1B
- 47R Yarnie Unit 2B