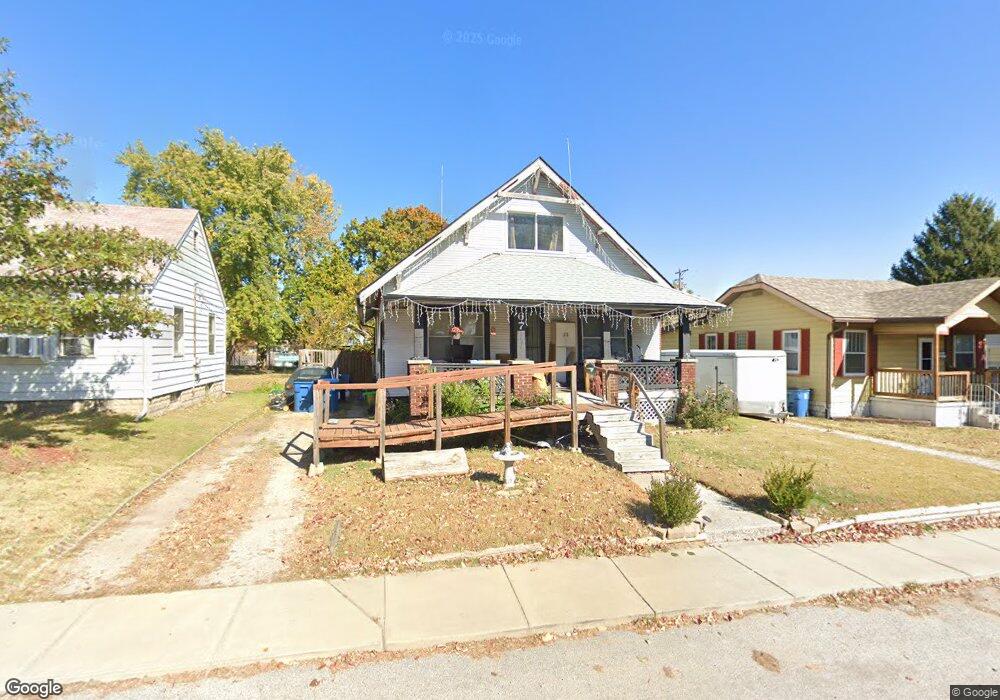
67 Harnett Ave Wood River, IL 62095
Estimated Value: $69,000 - $142,000
3
Beds
2
Baths
1,276
Sq Ft
$90/Sq Ft
Est. Value
About This Home
This home is located at 67 Harnett Ave, Wood River, IL 62095 and is currently estimated at $115,025, approximately $90 per square foot. 67 Harnett Ave is a home located in Madison County with nearby schools including Lewis-Clark Elementary School and East Alton-Wood River High School.
Ownership History
Date
Name
Owned For
Owner Type
Purchase Details
Closed on
Feb 4, 2025
Sold by
Sundstrom John L
Bought by
Unfried Mary Ellen and Unfried Keith Allen
Current Estimated Value
Purchase Details
Closed on
Sep 19, 2013
Sold by
Secretary Of Hud
Bought by
Sundstrom John L
Purchase Details
Closed on
Aug 18, 2008
Sold by
Douglas Sean and Douglas Rachel
Bought by
Krager Michael
Home Financials for this Owner
Home Financials are based on the most recent Mortgage that was taken out on this home.
Original Mortgage
$93,278
Interest Rate
6.42%
Mortgage Type
FHA
Purchase Details
Closed on
Dec 1, 2005
Sold by
Seago James D and Seago Nancy M
Bought by
Douglas Sean and Douglas Rachel
Home Financials for this Owner
Home Financials are based on the most recent Mortgage that was taken out on this home.
Original Mortgage
$71,780
Interest Rate
6.2%
Mortgage Type
Fannie Mae Freddie Mac
Create a Home Valuation Report for This Property
The Home Valuation Report is an in-depth analysis detailing your home's value as well as a comparison with similar homes in the area
Home Values in the Area
Average Home Value in this Area
Purchase History
| Date | Buyer | Sale Price | Title Company |
|---|---|---|---|
| Unfried Mary Ellen | -- | Ck | |
| Sundstrom John L | -- | Serenity Title & Escrow Ltd | |
| Krager Michael | $94,500 | First American Title Ins Co | |
| Douglas Sean | $74,000 | First American Title Ins Co |
Source: Public Records
Mortgage History
| Date | Status | Borrower | Loan Amount |
|---|---|---|---|
| Previous Owner | Krager Michael | $93,278 | |
| Previous Owner | Douglas Sean | $71,780 |
Source: Public Records
Tax History Compared to Growth
Tax History
| Year | Tax Paid | Tax Assessment Tax Assessment Total Assessment is a certain percentage of the fair market value that is determined by local assessors to be the total taxable value of land and additions on the property. | Land | Improvement |
|---|---|---|---|---|
| 2024 | $1,397 | $16,280 | $3,120 | $13,160 |
| 2023 | $1,397 | $15,180 | $2,910 | $12,270 |
| 2022 | $1,325 | $14,010 | $2,690 | $11,320 |
| 2021 | $1,227 | $13,060 | $2,510 | $10,550 |
| 2020 | $1,199 | $12,580 | $2,420 | $10,160 |
| 2019 | $1,157 | $12,210 | $2,350 | $9,860 |
| 2018 | $1,124 | $11,610 | $2,240 | $9,370 |
| 2017 | $1,048 | $11,340 | $2,190 | $9,150 |
| 2016 | $1,049 | $11,340 | $2,190 | $9,150 |
| 2015 | $2,184 | $23,950 | $2,170 | $21,780 |
| 2014 | $2,184 | $23,950 | $2,170 | $21,780 |
| 2013 | $2,184 | $24,290 | $2,200 | $22,090 |
Source: Public Records
Map
Nearby Homes
- 726 Rice St
- 777 Condit St
- 469 N 1st St
- 830 N Wood River Ave
- 833 State St
- 41 W Penning Ave
- 641 Leslie Ave
- 209 Elble Ave
- 98 Wood River Ave
- 72 E Acton Ave
- 207 E Penning Ave
- 121 Whitelaw Ave
- 104 Whitelaw Ave
- 959 Cedar Dr
- 133 Lincoln Ave
- 537 Tipton Ave
- 242 E Lorena Ave
- 523 Wilson Ave
- 565 5th St
- 529 5th St