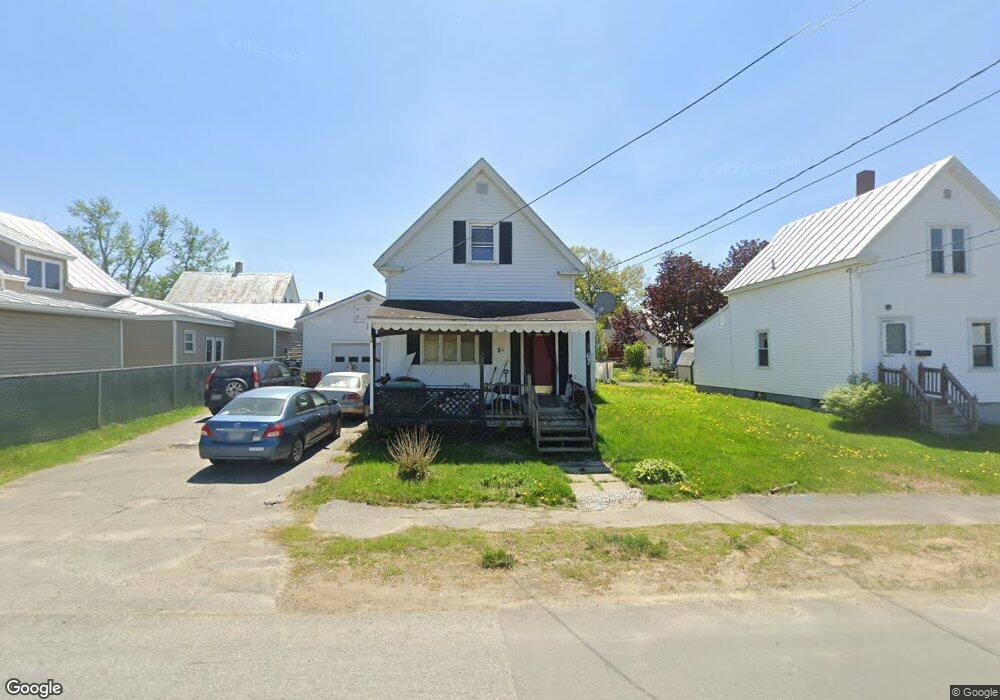
67 Hathaway St Skowhegan, ME 04976
Estimated Value: $162,000 - $210,000
3
Beds
1
Bath
1,218
Sq Ft
$151/Sq Ft
Est. Value
About This Home
This home is located at 67 Hathaway St, Skowhegan, ME 04976 and is currently estimated at $183,949, approximately $151 per square foot. 67 Hathaway St is a home located in Somerset County with nearby schools including Creative Children's Academy, Overman Academy, and Faith Baptist Christian School.
Ownership History
Date
Name
Owned For
Owner Type
Purchase Details
Closed on
May 5, 2014
Sold by
Department Of Housing & Urban Dev
Bought by
Dellarma Nicole A
Current Estimated Value
Purchase Details
Closed on
Sep 11, 2007
Sold by
Thibodeau William R and Thibodeau Dorothy M
Bought by
Mosier John P and Mosier Debra R
Home Financials for this Owner
Home Financials are based on the most recent Mortgage that was taken out on this home.
Original Mortgage
$88,600
Interest Rate
6.74%
Mortgage Type
FHA
Create a Home Valuation Report for This Property
The Home Valuation Report is an in-depth analysis detailing your home's value as well as a comparison with similar homes in the area
Home Values in the Area
Average Home Value in this Area
Purchase History
| Date | Buyer | Sale Price | Title Company |
|---|---|---|---|
| Dellarma Nicole A | -- | -- | |
| Mosier John P | -- | -- |
Source: Public Records
Mortgage History
| Date | Status | Borrower | Loan Amount |
|---|---|---|---|
| Previous Owner | Mosier John P | $88,600 |
Source: Public Records
Tax History Compared to Growth
Tax History
| Year | Tax Paid | Tax Assessment Tax Assessment Total Assessment is a certain percentage of the fair market value that is determined by local assessors to be the total taxable value of land and additions on the property. | Land | Improvement |
|---|---|---|---|---|
| 2024 | $1,724 | $95,400 | $18,000 | $77,400 |
| 2023 | $1,690 | $95,400 | $18,000 | $77,400 |
| 2022 | $1,400 | $80,100 | $12,600 | $67,500 |
| 2021 | $1,451 | $79,100 | $12,600 | $66,500 |
| 2020 | $864 | $71,100 | $12,600 | $58,500 |
| 2019 | $1,226 | $71,100 | $12,600 | $58,500 |
| 2018 | $1,294 | $71,100 | $12,600 | $58,500 |
| 2017 | $1,422 | $71,100 | $12,600 | $58,500 |
| 2016 | $1,432 | $75,200 | $13,400 | $61,800 |
| 2015 | $1,376 | $75,200 | $13,400 | $61,800 |
| 2014 | $1,290 | $75,200 | $13,400 | $61,800 |
| 2013 | $1,233 | $75,200 | $13,400 | $61,800 |
Source: Public Records
Map
Nearby Homes