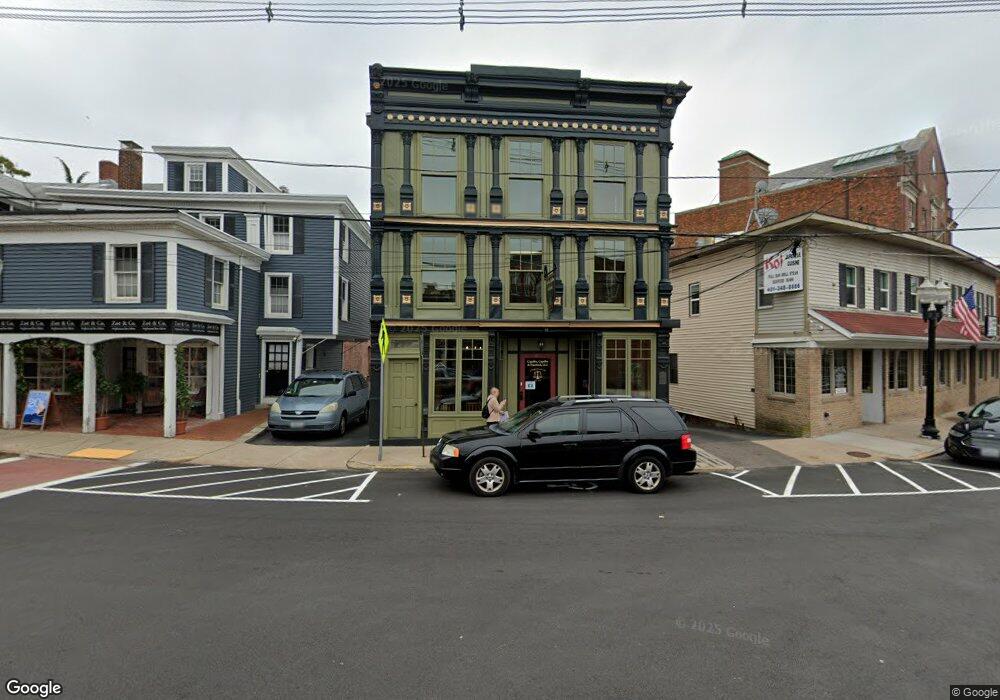
67 High St Westerly, RI 02891
Estimated Value: $410,186
Studio
--
Bath
5,052
Sq Ft
$81/Sq Ft
Est. Value
About This Home
This home is located at 67 High St, Westerly, RI 02891 and is currently estimated at $410,186, approximately $81 per square foot. 67 High St is a home located in Washington County with nearby schools including Westerly High School and St. Michael School.
Ownership History
Date
Name
Owned For
Owner Type
Purchase Details
Closed on
Mar 21, 2018
Sold by
Capalbo Thomas J
Bought by
Capalbo Properties Llc
Current Estimated Value
Purchase Details
Closed on
Apr 4, 2014
Sold by
Capalbo Thomas J
Bought by
Capalbo 3Rd Thomas J and Capalbo Perrilea P
Purchase Details
Closed on
Aug 2, 2013
Sold by
Capalbo Nicholas E
Bought by
Capalbo Nicholas E and Capalbo Ryan T
Purchase Details
Closed on
Mar 1, 2011
Sold by
Downtown Group Llc
Bought by
Capalbo 3Rd Thomas J
Home Financials for this Owner
Home Financials are based on the most recent Mortgage that was taken out on this home.
Original Mortgage
$136,000
Interest Rate
4.75%
Mortgage Type
Commercial
Purchase Details
Closed on
Nov 17, 2006
Sold by
553 Atlantic T
Bought by
Johnson Thomas
Create a Home Valuation Report for This Property
The Home Valuation Report is an in-depth analysis detailing your home's value as well as a comparison with similar homes in the area
Home Values in the Area
Average Home Value in this Area
Purchase History
| Date | Buyer | Sale Price | Title Company |
|---|---|---|---|
| Capalbo Properties Llc | -- | -- | |
| Capalbo 3Rd Thomas J | -- | -- | |
| Capalbo Nicholas E | -- | -- | |
| Capalbo Nicholas E | -- | -- | |
| Capalbo 3Rd Thomas J | $170,000 | -- | |
| Johnson Thomas | $125,000 | -- |
Source: Public Records
Mortgage History
| Date | Status | Borrower | Loan Amount |
|---|---|---|---|
| Previous Owner | Johnson Thomas | $230,000 | |
| Previous Owner | Johnson Thomas | $136,000 |
Source: Public Records
Tax History
| Year | Tax Paid | Tax Assessment Tax Assessment Total Assessment is a certain percentage of the fair market value that is determined by local assessors to be the total taxable value of land and additions on the property. | Land | Improvement |
|---|---|---|---|---|
| 2025 | $2,995 | $384,900 | $156,700 | $228,200 |
| 2024 | $3,717 | $355,700 | $142,100 | $213,600 |
| 2023 | $3,614 | $355,700 | $142,100 | $213,600 |
| 2022 | $3,593 | $355,700 | $142,100 | $213,600 |
| 2021 | $4,040 | $335,000 | $135,300 | $199,700 |
| 2020 | $3,970 | $335,000 | $135,300 | $199,700 |
| 2019 | $3,933 | $335,000 | $135,300 | $199,700 |
| 2018 | $4,200 | $340,100 | $131,400 | $208,700 |
| 2017 | $4,081 | $340,100 | $131,400 | $208,700 |
| 2016 | $4,081 | $340,100 | $131,400 | $208,700 |
| 2015 | $3,978 | $354,200 | $131,400 | $222,800 |
| 2014 | $3,914 | $354,200 | $131,400 | $222,800 |
Source: Public Records
Map
Nearby Homes
Your Personal Tour Guide
Ask me questions while you tour the home.