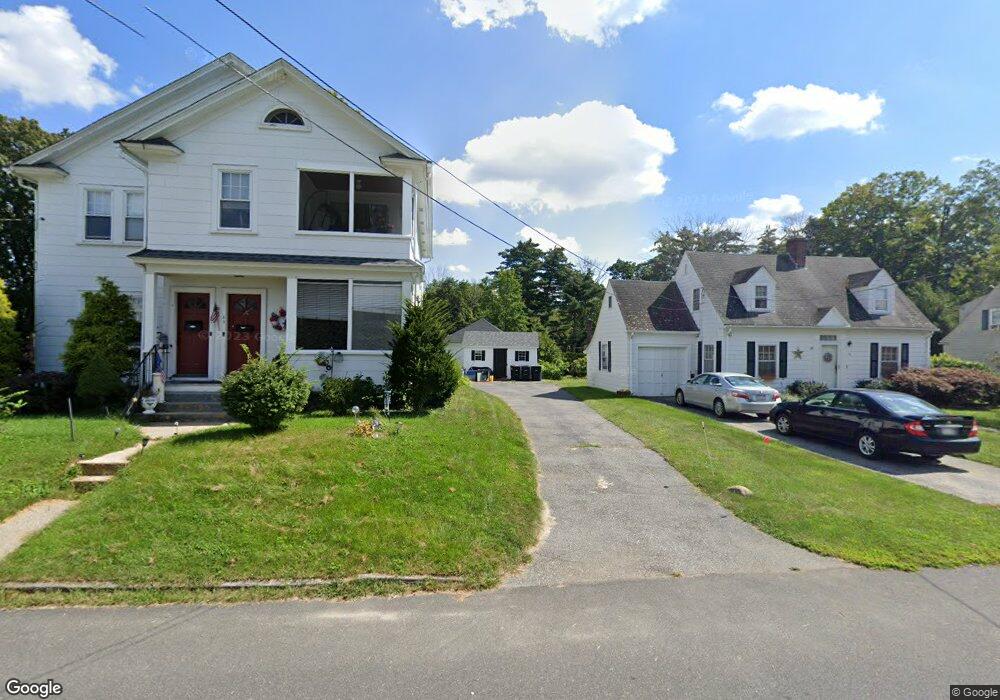
67 Highland St Southbridge, MA 01550
Estimated Value: $359,233 - $449,000
4
Beds
2
Baths
2,118
Sq Ft
$194/Sq Ft
Est. Value
About This Home
This home is located at 67 Highland St, Southbridge, MA 01550 and is currently estimated at $410,058, approximately $193 per square foot. 67 Highland St is a home located in Worcester County with nearby schools including Trinity Catholic Academy and ViewPoint Christian Academy.
Ownership History
Date
Name
Owned For
Owner Type
Purchase Details
Closed on
Oct 16, 2008
Sold by
Jalbert Paul R and Jalbert A R
Bought by
Koslowski Lisa L
Current Estimated Value
Home Financials for this Owner
Home Financials are based on the most recent Mortgage that was taken out on this home.
Original Mortgage
$164,000
Outstanding Balance
$108,952
Interest Rate
6.41%
Mortgage Type
Purchase Money Mortgage
Estimated Equity
$301,106
Purchase Details
Closed on
Apr 21, 2005
Sold by
Jalbert Paul R and Jalbert Suzanne A
Bought by
Jalbert Paul R and Jalbert A R
Create a Home Valuation Report for This Property
The Home Valuation Report is an in-depth analysis detailing your home's value as well as a comparison with similar homes in the area
Home Values in the Area
Average Home Value in this Area
Purchase History
| Date | Buyer | Sale Price | Title Company |
|---|---|---|---|
| Koslowski Lisa L | $205,000 | -- | |
| Koslowski Lisa L | $205,000 | -- | |
| Jalbert Paul R | -- | -- | |
| Jalbert Paul R | -- | -- |
Source: Public Records
Mortgage History
| Date | Status | Borrower | Loan Amount |
|---|---|---|---|
| Open | Koslowski Lisa L | $164,000 | |
| Closed | Jalbert Paul R | $164,000 |
Source: Public Records
Tax History Compared to Growth
Tax History
| Year | Tax Paid | Tax Assessment Tax Assessment Total Assessment is a certain percentage of the fair market value that is determined by local assessors to be the total taxable value of land and additions on the property. | Land | Improvement |
|---|---|---|---|---|
| 2025 | $4,615 | $314,800 | $37,000 | $277,800 |
| 2024 | $4,398 | $288,200 | $30,900 | $257,300 |
| 2023 | $4,136 | $261,100 | $30,900 | $230,200 |
| 2022 | $3,911 | $218,500 | $26,400 | $192,100 |
| 2021 | $3,474 | $178,700 | $26,400 | $152,300 |
| 2020 | $3,240 | $166,300 | $26,400 | $139,900 |
| 2018 | $3,079 | $148,400 | $26,400 | $122,000 |
| 2017 | $2,830 | $137,600 | $26,400 | $111,200 |
| 2016 | $2,781 | $137,600 | $26,400 | $111,200 |
| 2015 | $2,958 | $145,300 | $26,400 | $118,900 |
| 2014 | $2,854 | $145,300 | $26,400 | $118,900 |
Source: Public Records
Map
Nearby Homes