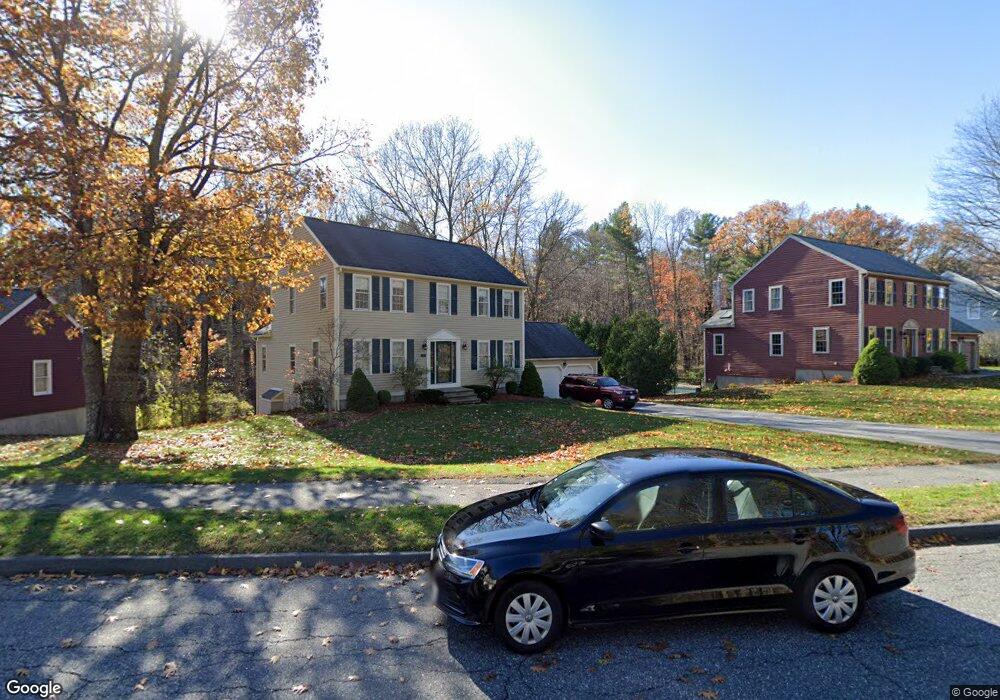
67 Hillando Dr Shrewsbury, MA 01545
Estimated Value: $843,859 - $997,000
4
Beds
3
Baths
2,094
Sq Ft
$426/Sq Ft
Est. Value
About This Home
This home is located at 67 Hillando Dr, Shrewsbury, MA 01545 and is currently estimated at $892,965, approximately $426 per square foot. 67 Hillando Dr is a home located in Worcester County with nearby schools including Floral Street School, Sherwood Middle School, and Oak Middle School.
Ownership History
Date
Name
Owned For
Owner Type
Purchase Details
Closed on
Oct 4, 1993
Sold by
Lodge Corp
Bought by
Grip Paul S and Grip Angela
Current Estimated Value
Home Financials for this Owner
Home Financials are based on the most recent Mortgage that was taken out on this home.
Original Mortgage
$187,900
Interest Rate
7%
Mortgage Type
Purchase Money Mortgage
Create a Home Valuation Report for This Property
The Home Valuation Report is an in-depth analysis detailing your home's value as well as a comparison with similar homes in the area
Home Values in the Area
Average Home Value in this Area
Purchase History
| Date | Buyer | Sale Price | Title Company |
|---|---|---|---|
| Grip Paul S | $208,824 | -- | |
| Grip Paul S | $208,824 | -- |
Source: Public Records
Mortgage History
| Date | Status | Borrower | Loan Amount |
|---|---|---|---|
| Open | Grip Paul S | $170,100 | |
| Closed | Grip Paul S | $30,000 | |
| Closed | Grip Paul S | $187,900 |
Source: Public Records
Tax History Compared to Growth
Tax History
| Year | Tax Paid | Tax Assessment Tax Assessment Total Assessment is a certain percentage of the fair market value that is determined by local assessors to be the total taxable value of land and additions on the property. | Land | Improvement |
|---|---|---|---|---|
| 2025 | $93 | $773,800 | $292,100 | $481,700 |
| 2024 | $9,273 | $749,000 | $278,200 | $470,800 |
| 2023 | $8,727 | $665,200 | $278,200 | $387,000 |
| 2022 | $7,674 | $543,900 | $218,600 | $325,300 |
| 2021 | $6,879 | $521,500 | $218,600 | $302,900 |
| 2020 | $6,471 | $518,900 | $218,600 | $300,300 |
| 2019 | $6,181 | $491,700 | $204,200 | $287,500 |
| 2018 | $6,040 | $477,100 | $192,400 | $284,700 |
| 2017 | $5,768 | $449,600 | $174,200 | $275,400 |
| 2016 | $5,780 | $444,600 | $163,200 | $281,400 |
| 2015 | $5,606 | $424,700 | $149,300 | $275,400 |
Source: Public Records
Map
Nearby Homes
- 39 Harvard Ave
- 65 Commons Dr Unit 502
- 65 Commons Dr Unit 410
- 85 Commons Dr Unit 210
- 22 Hitching Post Ln
- 11 Hillside Rd
- 24 Brook St
- 562 South St
- 39 Old Brook Rd
- 10 Falcon Dr
- 3 Brookdale Cir
- 457 Walnut St
- 603 South St
- 4 Horseneck Rd
- 243 Spring St
- 139 Davis St
- 18 Eastwood Rd
- 26 High St
- 40 High St
- 647 Main St