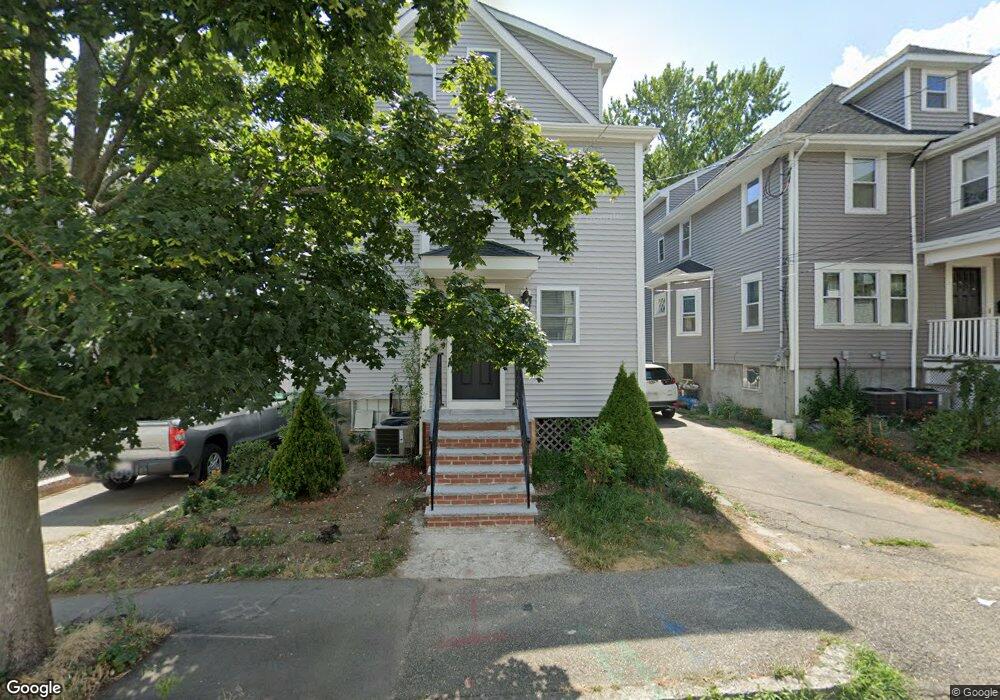
67 Holmes St Quincy, MA 02171
Montclair NeighborhoodEstimated Value: $678,000 - $1,387,000
2
Beds
2
Baths
3,147
Sq Ft
$362/Sq Ft
Est. Value
About This Home
This home is located at 67 Holmes St, Quincy, MA 02171 and is currently estimated at $1,138,239, approximately $361 per square foot. 67 Holmes St is a home located in Norfolk County with nearby schools including Montclair Elementary School, Atlantic Middle School, and North Quincy High School.
Ownership History
Date
Name
Owned For
Owner Type
Purchase Details
Closed on
Sep 21, 2011
Sold by
Guan Xian Q and Guan Jian
Bought by
Guan Jian and Guan Lin Q
Current Estimated Value
Home Financials for this Owner
Home Financials are based on the most recent Mortgage that was taken out on this home.
Original Mortgage
$183,000
Outstanding Balance
$72,235
Interest Rate
4.33%
Mortgage Type
Purchase Money Mortgage
Estimated Equity
$1,066,004
Purchase Details
Closed on
May 2, 2005
Sold by
Norfolk Downs Rt
Bought by
Guan Jian and Guan Lin Q
Home Financials for this Owner
Home Financials are based on the most recent Mortgage that was taken out on this home.
Original Mortgage
$270,000
Interest Rate
5.95%
Mortgage Type
Purchase Money Mortgage
Purchase Details
Closed on
Dec 22, 2000
Sold by
Drew Tr James M and Drew Agnes R
Bought by
Gardner St T
Purchase Details
Closed on
Oct 29, 1999
Sold by
Nocher Tr Robert J
Bought by
Norfolk Downs Rt
Create a Home Valuation Report for This Property
The Home Valuation Report is an in-depth analysis detailing your home's value as well as a comparison with similar homes in the area
Home Values in the Area
Average Home Value in this Area
Purchase History
| Date | Buyer | Sale Price | Title Company |
|---|---|---|---|
| Guan Jian | -- | -- | |
| Guan Jian | $339,000 | -- | |
| Gardner St T | $120,000 | -- | |
| Norfolk Downs Rt | $139,000 | -- |
Source: Public Records
Mortgage History
| Date | Status | Borrower | Loan Amount |
|---|---|---|---|
| Open | Guan Jian | $183,000 | |
| Previous Owner | Guan Jian | $270,000 |
Source: Public Records
Tax History Compared to Growth
Tax History
| Year | Tax Paid | Tax Assessment Tax Assessment Total Assessment is a certain percentage of the fair market value that is determined by local assessors to be the total taxable value of land and additions on the property. | Land | Improvement |
|---|---|---|---|---|
| 2025 | $13,198 | $1,144,700 | $328,900 | $815,800 |
| 2024 | $12,630 | $1,120,700 | $328,900 | $791,800 |
| 2023 | $12,332 | $1,108,000 | $313,300 | $794,700 |
| 2022 | $9,378 | $782,800 | $272,400 | $510,400 |
| 2021 | $5,875 | $483,900 | $259,500 | $224,400 |
| 2020 | $5,745 | $462,200 | $259,500 | $202,700 |
| 2019 | $5,472 | $436,000 | $242,500 | $193,500 |
| 2018 | $5,381 | $403,400 | $224,500 | $178,900 |
| 2017 | $5,338 | $376,700 | $213,800 | $162,900 |
| 2016 | $4,868 | $339,000 | $185,900 | $153,100 |
| 2015 | $4,520 | $309,600 | $169,000 | $140,600 |
| 2014 | $4,309 | $290,000 | $161,000 | $129,000 |
Source: Public Records
Map
Nearby Homes
- 17 Holmes St Unit 2
- 115 W Squantum St Unit 907
- 115 W Squantum St Unit 810
- 511 Hancock St Unit 207
- 522 Hancock St
- 21 Linden St Unit 417
- 143 Arlington St
- 85 E Squantum St Unit 10
- 204 Farrington St
- 1 Edwin St Unit C
- 43 Ellington Rd
- 237 Billings Rd
- 101 Beach St
- 150 Hancock St Unit 102
- 129 Beale St
- 41 Davis St
- 85 Myrtle St Unit 105
- 201 Billings St
- 65 - 67 Davis St
- 365 Newport Ave Unit 301
- 69 Holmes St Unit 2
- 69 Holmes St Unit 1
- 69 Holmes St
- 69 Holmes St Unit 73
- 69 Holmes St Unit 69
- 71 Holmes St
- 2 Billings Rd
- 73 Holmes St
- 16 Billings Rd
- 16 Billings Rd Unit 2
- 16 Billings Rd Unit 2nd Floor
- 16 Billings Rd Unit 1
- 16 Billings Rd Unit B
- 16 Billings Rd Unit A
- 63 Holmes St
- 65 Holmes St
- 70 Holmes St
- 6 Billings Rd
- 18 Billings Rd
- 18 Billings Rd Unit 2nd Floor