C
Seller's Agent in 2016
Christine Moore
Crescent Hill Real Estate
(978) 985-8455
14 Total Sales
Estimated Value: $523,000 - $602,000
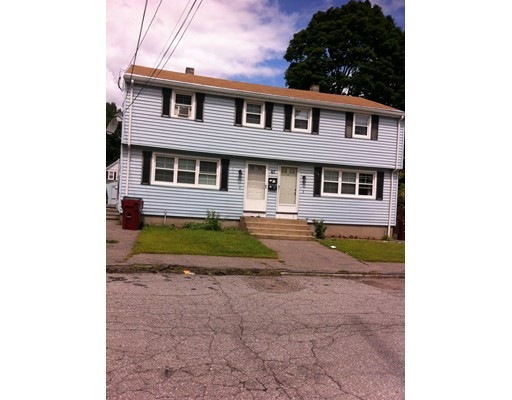
This home is located at 67 Inland St, Lowell, MA 01851 since 06 May 2015 and is currently estimated at $576,400, approximately $288 per square foot. This property was built in 1958. 67 Inland St is a home located in Middlesex County with nearby schools including Abraham Lincoln Elementary School, Moody Elementary School, and Greenhalge Elementary School.
Home Type
Multi-Family
Year Built
1958
Lot Details
0
| Date | Buyer | Sale Price | Title Company |
|---|---|---|---|
| 67 Inalnd Street Ret | -- | -- | |
| 67 Inalnd Street Ret | -- | -- | |
| Le An | $273,000 | -- | |
| Mutungi Catherine W | $245,000 | -- | |
| Mutungi Catherine W | $245,000 | -- | |
| Wells Fargo Bk | $282,581 | -- | |
| Wells Fargo Bk | $282,581 | -- | |
| Simsek Christine | -- | -- | |
| Simsek Christine | -- | -- | |
| Simsek Christine | -- | -- | |
| Wilson Ian | $225,000 | -- | |
| Wilson Ian | $225,000 | -- |
| Date | Status | Borrower | Loan Amount |
|---|---|---|---|
| Previous Owner | Wilson Ian | $245,000 | |
| Previous Owner | Wilson Ian | $244,832 |
| Date | Event | Price | List to Sale | Price per Sq Ft |
|---|---|---|---|---|
| 10/18/2016 10/18/16 | Sold | $273,000 | 0.0% | $137 / Sq Ft |
| 03/01/2016 03/01/16 | Price Changed | $273,000 | -7.5% | $137 / Sq Ft |
| 12/10/2015 12/10/15 | Pending | -- | -- | -- |
| 12/02/2015 12/02/15 | Price Changed | $295,000 | -9.2% | $148 / Sq Ft |
| 11/25/2015 11/25/15 | For Sale | $325,000 | 0.0% | $163 / Sq Ft |
| 05/27/2015 05/27/15 | Pending | -- | -- | -- |
| 05/06/2015 05/06/15 | For Sale | $325,000 | -- | $163 / Sq Ft |
| Year | Tax Paid | Tax Assessment Tax Assessment Total Assessment is a certain percentage of the fair market value that is determined by local assessors to be the total taxable value of land and additions on the property. | Land | Improvement |
|---|---|---|---|---|
| 2025 | $6,033 | $525,500 | $179,200 | $346,300 |
| 2024 | $5,687 | $477,500 | $167,500 | $310,000 |
| 2023 | $5,388 | $433,800 | $145,700 | $288,100 |
| 2022 | $4,763 | $375,300 | $132,500 | $242,800 |
| 2021 | $4,525 | $336,200 | $115,200 | $221,000 |
| 2020 | $4,083 | $305,600 | $103,400 | $202,200 |
| 2019 | $4,011 | $285,700 | $102,400 | $183,300 |
| 2018 | $3,884 | $264,800 | $97,600 | $167,200 |
| 2017 | $3,833 | $256,900 | $94,500 | $162,400 |
| 2016 | $3,632 | $239,600 | $85,200 | $154,400 |
| 2015 | $3,461 | $223,600 | $85,200 | $138,400 |
| 2013 | $3,505 | $233,500 | $97,200 | $136,300 |
C
Seller's Agent in 2016
Christine Moore
Crescent Hill Real Estate
(978) 985-8455
14 Total Sales
Source: MLS Property Information Network (MLS PIN)
MLS Number: 71840938
APN: LOWE-000126-003165-000067
Disclaimer: Certain information contained herein is derived from information provided by parties other than Homes.com. All information provided is deemed reliable, but is not guaranteed to be accurate and should be independently verified.
![]() The property listing data and information, or the Images, set forth herein were provided to MLS Property Information Network, Inc. from third party sources, including sellers, lessors and public records, and were compiled by MLS Property Information Network, Inc. The property listing data and information, and the Images, are for the personal, non-commercial use of consumers having a good faith interest in purchasing or leasing listed properties of the type displayed to them and may not be used for any purpose other than to identify prospective properties which such consumers may have a good faith interest in purchasing or leasing. MLS Property Information Network, Inc. and its subscribers disclaim any and all representations and warranties as to the accuracy of the property listing data and information, or as to the accuracy of any of the Images, set forth herein.
The property listing data and information, or the Images, set forth herein were provided to MLS Property Information Network, Inc. from third party sources, including sellers, lessors and public records, and were compiled by MLS Property Information Network, Inc. The property listing data and information, and the Images, are for the personal, non-commercial use of consumers having a good faith interest in purchasing or leasing listed properties of the type displayed to them and may not be used for any purpose other than to identify prospective properties which such consumers may have a good faith interest in purchasing or leasing. MLS Property Information Network, Inc. and its subscribers disclaim any and all representations and warranties as to the accuracy of the property listing data and information, or as to the accuracy of any of the Images, set forth herein.
