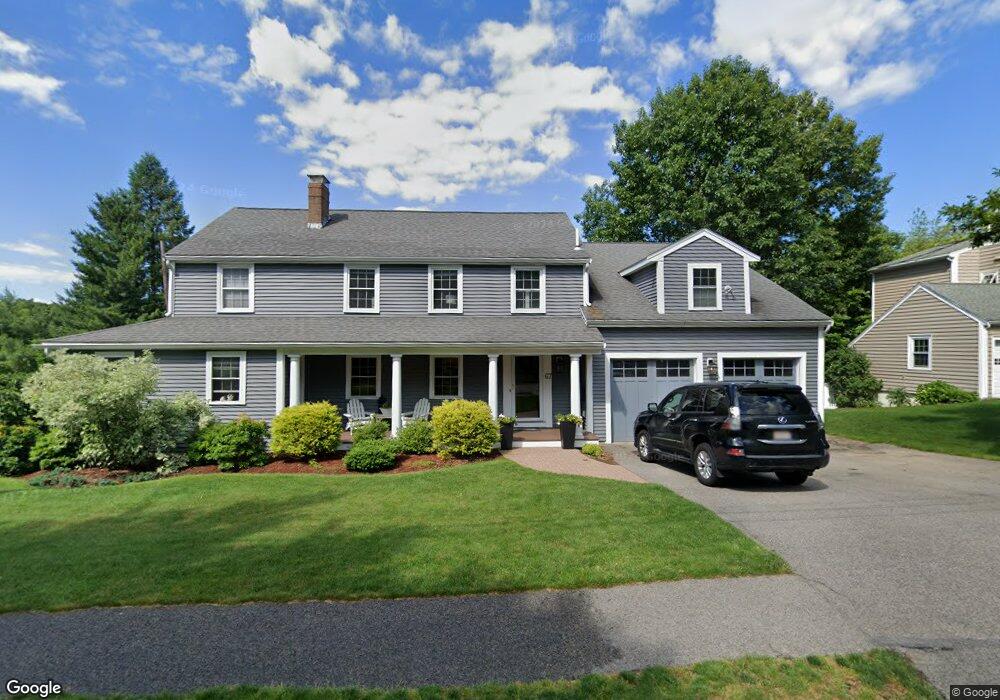
67 Kenney St Needham, MA 02492
Estimated Value: $1,148,000 - $2,318,000
4
Beds
4
Baths
1,996
Sq Ft
$879/Sq Ft
Est. Value
About This Home
This home is located at 67 Kenney St, Needham, MA 02492 and is currently estimated at $1,755,043, approximately $879 per square foot. 67 Kenney St is a home located in Norfolk County with nearby schools including Broadmeadow Elementary School, High Rock Middle School, and Pollard Middle School.
Ownership History
Date
Name
Owned For
Owner Type
Purchase Details
Closed on
Jun 15, 2001
Sold by
Guerrero Maria A
Bought by
Berner Bernhard and Berner Kathleen A
Current Estimated Value
Create a Home Valuation Report for This Property
The Home Valuation Report is an in-depth analysis detailing your home's value as well as a comparison with similar homes in the area
Home Values in the Area
Average Home Value in this Area
Purchase History
| Date | Buyer | Sale Price | Title Company |
|---|---|---|---|
| Berner Bernhard | $453,800 | -- |
Source: Public Records
Mortgage History
| Date | Status | Borrower | Loan Amount |
|---|---|---|---|
| Open | Berner Bernhard | $810,000 | |
| Closed | Berner Bernhard | $350,000 | |
| Closed | Berner Bernhard | $353,000 |
Source: Public Records
Tax History
| Year | Tax Paid | Tax Assessment Tax Assessment Total Assessment is a certain percentage of the fair market value that is determined by local assessors to be the total taxable value of land and additions on the property. | Land | Improvement |
|---|---|---|---|---|
| 2025 | $16,070 | $1,516,000 | $805,100 | $710,900 |
| 2024 | $15,147 | $1,209,800 | $592,500 | $617,300 |
| 2023 | $15,073 | $1,155,900 | $592,500 | $563,400 |
| 2022 | $14,218 | $1,063,400 | $524,700 | $538,700 |
| 2021 | $13,856 | $1,063,400 | $524,700 | $538,700 |
| 2020 | $13,715 | $1,098,100 | $524,700 | $573,400 |
| 2019 | $12,923 | $1,043,000 | $477,300 | $565,700 |
| 2018 | $12,391 | $1,043,000 | $477,300 | $565,700 |
| 2017 | $11,590 | $974,800 | $477,300 | $497,500 |
| 2016 | $11,249 | $974,800 | $477,300 | $497,500 |
| 2015 | $11,005 | $974,800 | $477,300 | $497,500 |
| 2014 | $10,186 | $875,100 | $398,300 | $476,800 |
Source: Public Records
Map
Nearby Homes
- 14 Rockwood Ln
- 883 Greendale Ave
- 85 Dawson Dr
- 72 Valley Rd
- 60 Douglas Rd
- 78 Birds Hill Ave
- 31 Birds Hill Ave
- 176 Highgate St
- 28 Green St
- 50 Sterling Rd
- 68 Brookline St
- 242 Valley Rd
- 126 Prince St
- 1204 Greendale Ave Unit 128
- 1202 Greendale Ave Unit 124
- 133 Prince St
- 1206 Greendale Ave Unit 217
- 1206 Greendale Ave Unit 201
- 1212 Greendale Ave Unit 300
- 190 Brookline St
Your Personal Tour Guide
Ask me questions while you tour the home.