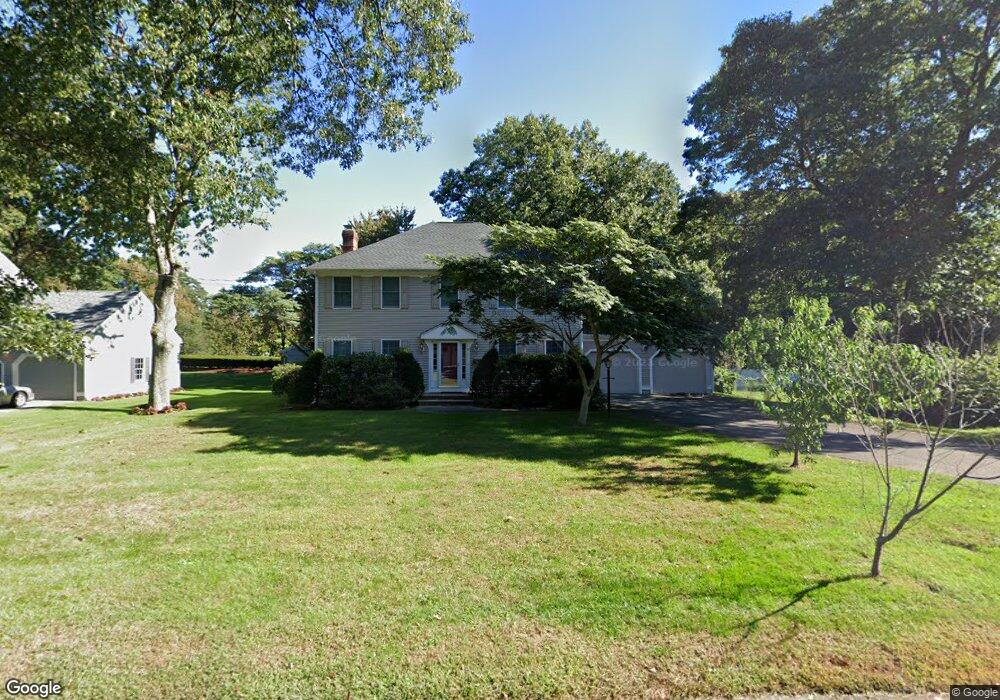
67 Laconia St Lexington, MA 02420
Countryside NeighborhoodEstimated Value: $1,554,000 - $1,991,000
4
Beds
3
Baths
2,280
Sq Ft
$764/Sq Ft
Est. Value
About This Home
This home is located at 67 Laconia St, Lexington, MA 02420 and is currently estimated at $1,742,745, approximately $764 per square foot. 67 Laconia St is a home located in Middlesex County with nearby schools including Harrington Elementary School, Jonas Clarke Middle School, and Lexington High School.
Ownership History
Date
Name
Owned For
Owner Type
Purchase Details
Closed on
Dec 1, 2003
Sold by
Pan Sha-Mei Liao
Bought by
Pan Zane Zheng-Yan
Current Estimated Value
Purchase Details
Closed on
Jan 7, 1994
Sold by
Homes Rlty Corp
Bought by
Liao Pan Zane Zheng-Yan and Liao Pan Sha-Mei
Purchase Details
Closed on
Sep 10, 1993
Sold by
Desaintphalle J and De Saint Phalle Phil
Bought by
Homes Rlty Corp
Purchase Details
Closed on
Sep 15, 1988
Sold by
Miller Richard I
Bought by
Desaintphalle Philippe
Create a Home Valuation Report for This Property
The Home Valuation Report is an in-depth analysis detailing your home's value as well as a comparison with similar homes in the area
Home Values in the Area
Average Home Value in this Area
Purchase History
| Date | Buyer | Sale Price | Title Company |
|---|---|---|---|
| Pan Zane Zheng-Yan | -- | -- | |
| Liao Pan Zane Zheng-Yan | $385,000 | -- | |
| Homes Rlty Corp | $180,000 | -- | |
| Desaintphalle Philippe | $156,980 | -- |
Source: Public Records
Mortgage History
| Date | Status | Borrower | Loan Amount |
|---|---|---|---|
| Open | Desaintphalle Philippe | $179,000 | |
| Closed | Desaintphalle Philippe | $192,000 | |
| Closed | Desaintphalle Philippe | $205,000 |
Source: Public Records
Tax History Compared to Growth
Tax History
| Year | Tax Paid | Tax Assessment Tax Assessment Total Assessment is a certain percentage of the fair market value that is determined by local assessors to be the total taxable value of land and additions on the property. | Land | Improvement |
|---|---|---|---|---|
| 2025 | $17,562 | $1,436,000 | $729,000 | $707,000 |
| 2024 | $17,493 | $1,428,000 | $694,000 | $734,000 |
| 2023 | $17,160 | $1,320,000 | $631,000 | $689,000 |
| 2022 | $16,118 | $1,168,000 | $574,000 | $594,000 |
| 2021 | $15,512 | $1,078,000 | $546,000 | $532,000 |
| 2020 | $15,160 | $1,079,000 | $546,000 | $533,000 |
| 2019 | $14,544 | $1,030,000 | $520,000 | $510,000 |
| 2018 | $13,943 | $975,000 | $475,000 | $500,000 |
| 2017 | $13,809 | $953,000 | $462,000 | $491,000 |
| 2016 | $13,476 | $923,000 | $440,000 | $483,000 |
| 2015 | $13,151 | $885,000 | $400,000 | $485,000 |
| 2014 | $12,361 | $797,000 | $379,000 | $418,000 |
Source: Public Records
Map
Nearby Homes