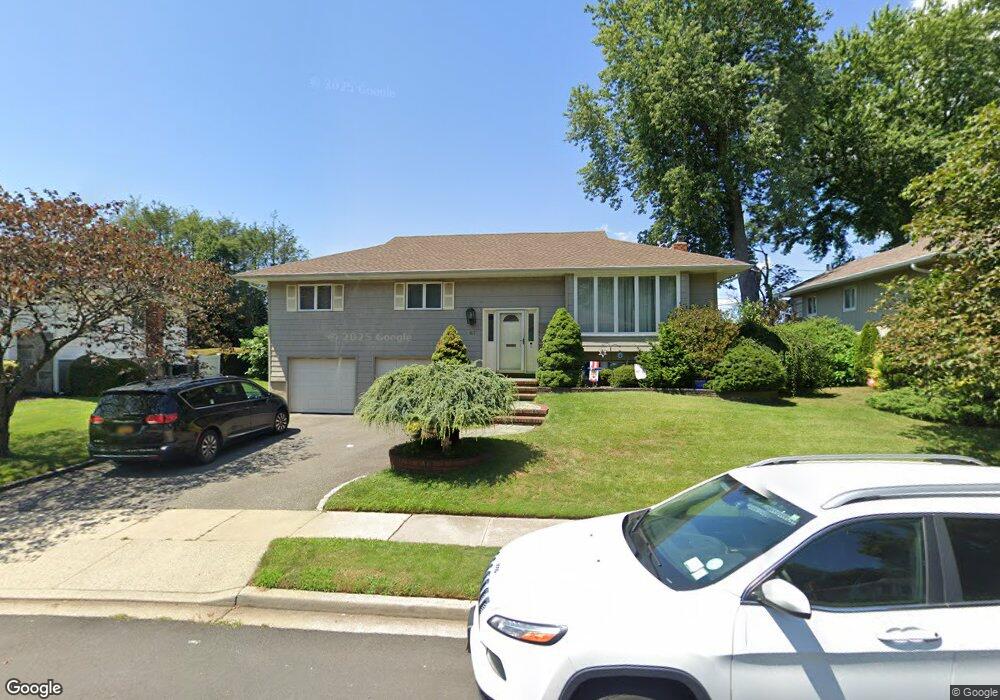
67 Lent Dr Plainview, NY 11803
Estimated Value: $931,384 - $1,050,000
5
Beds
3
Baths
1,536
Sq Ft
$645/Sq Ft
Est. Value
About This Home
This home is located at 67 Lent Dr, Plainview, NY 11803 and is currently estimated at $990,692, approximately $644 per square foot. 67 Lent Dr is a home located in Nassau County with nearby schools including Old Bethpage School, Plainview Old Bethpage Middle School, and Plainview-Old Bethpage John F. Kennedy High School.
Ownership History
Date
Name
Owned For
Owner Type
Purchase Details
Closed on
May 18, 2017
Sold by
Hershman Harold and Hershman Barbara
Bought by
Greenberg Michael and Greenberg Dorothy
Current Estimated Value
Home Financials for this Owner
Home Financials are based on the most recent Mortgage that was taken out on this home.
Original Mortgage
$532,000
Outstanding Balance
$440,837
Interest Rate
3.97%
Mortgage Type
New Conventional
Estimated Equity
$549,855
Create a Home Valuation Report for This Property
The Home Valuation Report is an in-depth analysis detailing your home's value as well as a comparison with similar homes in the area
Home Values in the Area
Average Home Value in this Area
Purchase History
| Date | Buyer | Sale Price | Title Company |
|---|---|---|---|
| Greenberg Michael | $665,000 | None Available |
Source: Public Records
Mortgage History
| Date | Status | Borrower | Loan Amount |
|---|---|---|---|
| Open | Greenberg Michael | $532,000 |
Source: Public Records
Tax History
| Year | Tax Paid | Tax Assessment Tax Assessment Total Assessment is a certain percentage of the fair market value that is determined by local assessors to be the total taxable value of land and additions on the property. | Land | Improvement |
|---|---|---|---|---|
| 2025 | $16,752 | $573 | $262 | $311 |
| 2024 | $4,997 | $622 | $305 | $317 |
Source: Public Records
Map
Nearby Homes
Your Personal Tour Guide
Ask me questions while you tour the home.