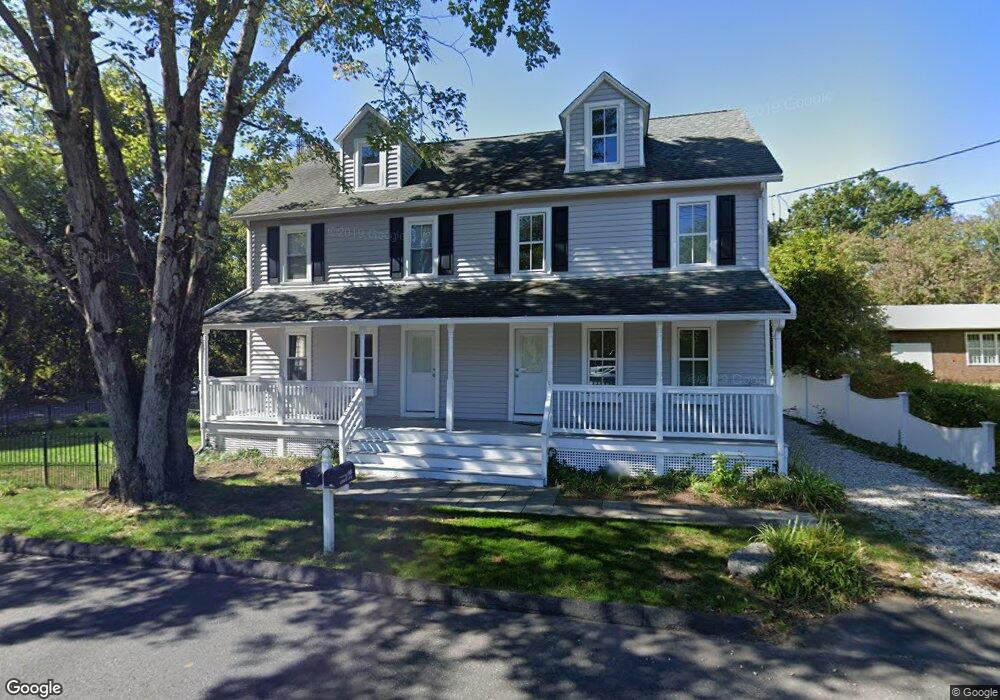
67 Leroy Ave Darien, CT 06820
Estimated Value: $1,076,000 - $1,399,466
2
Beds
1
Bath
1,300
Sq Ft
$954/Sq Ft
Est. Value
About This Home
This home is located at 67 Leroy Ave, Darien, CT 06820 and is currently estimated at $1,239,822, approximately $953 per square foot. 67 Leroy Ave is a home located in Fairfield County with nearby schools including Royle Elementary School, Middlesex Middle School, and Darien High School.
Ownership History
Date
Name
Owned For
Owner Type
Purchase Details
Closed on
Nov 10, 2015
Sold by
Blackburn Tyson and Messios-Blackburn Anne
Bought by
Leroy Properties Llc
Current Estimated Value
Purchase Details
Closed on
Dec 15, 2014
Sold by
Messios-Blackburn Anne E
Bought by
Blackburn Tyson and Messios-Blackburn Anne E
Purchase Details
Closed on
Nov 19, 2013
Sold by
Grimaldi Richard A
Bought by
Messios-Blackburn Anne E
Home Financials for this Owner
Home Financials are based on the most recent Mortgage that was taken out on this home.
Original Mortgage
$692,230
Interest Rate
4.12%
Mortgage Type
FHA
Purchase Details
Closed on
Feb 2, 1996
Sold by
Smith Todd and Smith Dennis
Bought by
Grimaldi Richard
Home Financials for this Owner
Home Financials are based on the most recent Mortgage that was taken out on this home.
Original Mortgage
$222,000
Interest Rate
7.25%
Mortgage Type
Unknown
Create a Home Valuation Report for This Property
The Home Valuation Report is an in-depth analysis detailing your home's value as well as a comparison with similar homes in the area
Home Values in the Area
Average Home Value in this Area
Purchase History
| Date | Buyer | Sale Price | Title Company |
|---|---|---|---|
| Leroy Properties Llc | $1,000,000 | -- | |
| Blackburn Tyson | -- | -- | |
| Messios-Blackburn Anne E | $705,000 | -- | |
| Grimaldi Richard | $275,000 | -- |
Source: Public Records
Mortgage History
| Date | Status | Borrower | Loan Amount |
|---|---|---|---|
| Previous Owner | Grimaldi Richard | $692,230 | |
| Previous Owner | Grimaldi Richard | $416,000 | |
| Previous Owner | Grimaldi Richard | $222,000 |
Source: Public Records
Tax History Compared to Growth
Tax History
| Year | Tax Paid | Tax Assessment Tax Assessment Total Assessment is a certain percentage of the fair market value that is determined by local assessors to be the total taxable value of land and additions on the property. | Land | Improvement |
|---|---|---|---|---|
| 2025 | $10,089 | $651,770 | $357,490 | $294,280 |
| 2024 | $9,575 | $651,770 | $357,490 | $294,280 |
| 2023 | $9,805 | $556,780 | $340,480 | $216,300 |
| 2022 | $9,593 | $556,780 | $340,480 | $216,300 |
| 2021 | $9,376 | $556,780 | $340,480 | $216,300 |
| 2020 | $9,109 | $556,780 | $340,480 | $216,300 |
| 2019 | $9,170 | $556,780 | $340,480 | $216,300 |
| 2018 | $8,448 | $525,350 | $294,000 | $231,350 |
| 2017 | $8,490 | $525,350 | $294,000 | $231,350 |
| 2016 | $7,215 | $457,520 | $294,000 | $163,520 |
| 2015 | $7,023 | $457,520 | $294,000 | $163,520 |
| 2014 | $6,867 | $457,520 | $294,000 | $163,520 |
Source: Public Records
Map
Nearby Homes
- 51 Hale Ln Unit 51
- 10 Stony Brook Rd
- 128 West Ave
- 130 West Ave
- 20 Locust Hill Rd
- 93 Mansfield Ave
- 10 Prospect Ave
- 8 Sedgewick Village Ln
- 17 Brushy Hill Rd
- 17 Pine Brook Ln Unit 17
- 10 Pine Brook Ln
- 45 Hecker Ave
- 6 Priscilla Ln
- 311 Noroton Ave
- 5 Wakeman Rd
- 53 Noroton Ave
- 19 Littlebrook Rd
- 261 Hollow Tree Ridge Rd
- 77 Maple St
- 18 Tokeneke Trail
- 73 Leroy Ave
- 6 Bailey Ave
- 8 Bailey Ave
- 77 Leroy Ave Unit 308
- 77 Leroy Ave Unit 201
- 77 Leroy Ave Unit 303
- 77 Leroy Ave Unit 203
- 77 Leroy Ave Unit 302
- 77 Leroy Ave Unit 202
- 77 Leroy Ave Unit 204
- 77 Leroy Ave Unit 304
- 77 Leroy Ave Unit 301
- 77 Leroy Ave Unit 305
- 77 Leroy Ave Unit 205
- 77 Leroy Ave Unit 307
- 77 Leroy Ave Unit 207
- 77 Leroy Ave
- 77 Leroy (Pemberton 16) Ave Unit 205
- 77 Leroy (Pemberton 16) Ave Unit 204
- 63 West Ave