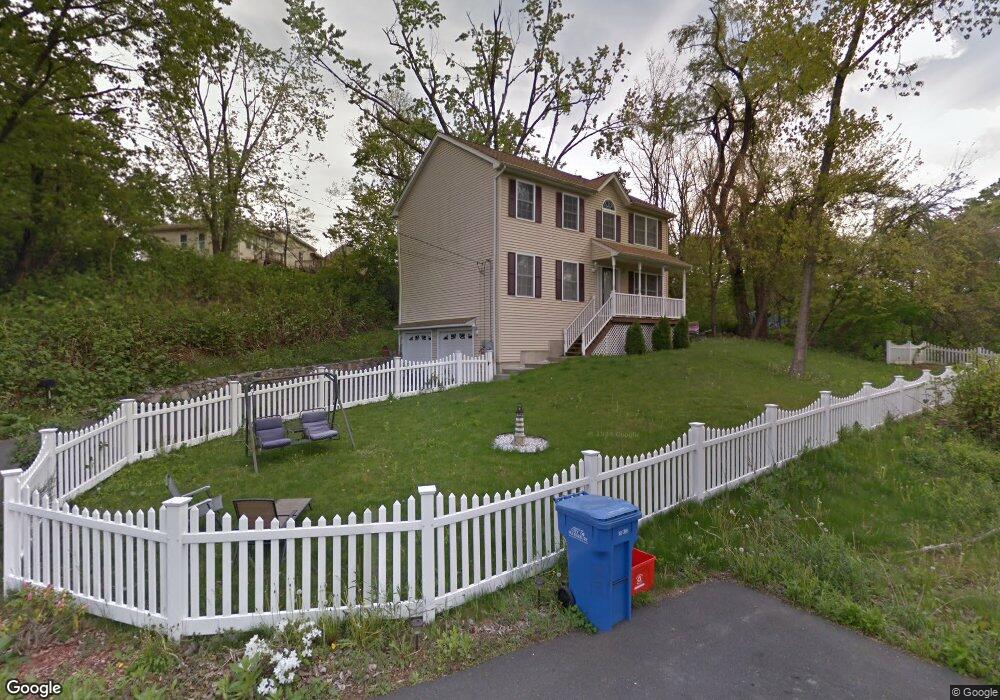
67 Lowland Ave Waterbury, CT 06706
South End District NeighborhoodEstimated Value: $375,889 - $425,000
3
Beds
3
Baths
1,998
Sq Ft
$201/Sq Ft
Est. Value
About This Home
This home is located at 67 Lowland Ave, Waterbury, CT 06706 and is currently estimated at $401,972, approximately $201 per square foot. 67 Lowland Ave is a home located in New Haven County with nearby schools including John G. Gilmartin Elementary School, John F. Kennedy High School, and St Peter & Paul School.
Ownership History
Date
Name
Owned For
Owner Type
Purchase Details
Closed on
Jul 9, 2025
Sold by
Delgado Ervin
Bought by
Vargas Sarita S
Current Estimated Value
Purchase Details
Closed on
Oct 11, 2018
Sold by
Vargas Mario and Vargas Carman
Bought by
Delgado Ervin
Purchase Details
Closed on
Jul 31, 2018
Sold by
Vargas Mario and Vargas Carmen
Bought by
Delgado Ervin
Home Financials for this Owner
Home Financials are based on the most recent Mortgage that was taken out on this home.
Original Mortgage
$75,000
Interest Rate
4.6%
Mortgage Type
New Conventional
Purchase Details
Closed on
Jul 2, 2007
Sold by
Bejolli Zarif and Bejolli Velentina
Bought by
Vargas Mario and Vargas Carmen
Create a Home Valuation Report for This Property
The Home Valuation Report is an in-depth analysis detailing your home's value as well as a comparison with similar homes in the area
Home Values in the Area
Average Home Value in this Area
Purchase History
| Date | Buyer | Sale Price | Title Company |
|---|---|---|---|
| Vargas Sarita S | -- | -- | |
| Delgado Ervin | $190,000 | -- | |
| Delgado Ervin | $190,000 | -- | |
| Delgado Ervin | $190,000 | -- | |
| Delgado Ervin | $190,000 | -- | |
| Vargas Mario | $220,000 | -- | |
| Vargas Mario | $220,000 | -- |
Source: Public Records
Mortgage History
| Date | Status | Borrower | Loan Amount |
|---|---|---|---|
| Previous Owner | Vargas Mario | $75,000 |
Source: Public Records
Tax History Compared to Growth
Tax History
| Year | Tax Paid | Tax Assessment Tax Assessment Total Assessment is a certain percentage of the fair market value that is determined by local assessors to be the total taxable value of land and additions on the property. | Land | Improvement |
|---|---|---|---|---|
| 2025 | $8,618 | $191,590 | $14,420 | $177,170 |
| 2024 | $9,472 | $191,590 | $14,420 | $177,170 |
| 2023 | $10,382 | $191,590 | $14,420 | $177,170 |
| 2022 | $7,206 | $119,680 | $14,410 | $105,270 |
| 2021 | $7,206 | $119,680 | $14,410 | $105,270 |
| 2020 | $7,206 | $119,680 | $14,410 | $105,270 |
| 2019 | $7,206 | $119,680 | $14,410 | $105,270 |
| 2018 | $7,206 | $119,680 | $14,410 | $105,270 |
| 2017 | $6,933 | $115,140 | $14,410 | $100,730 |
| 2016 | $6,933 | $115,140 | $14,410 | $100,730 |
| 2015 | $6,703 | $115,140 | $14,410 | $100,730 |
| 2014 | $6,703 | $115,140 | $14,410 | $100,730 |
Source: Public Records
Map
Nearby Homes
- 51 Clover St
- 41 Floyd St
- 0372 Floyd St
- 0039 Floyd St
- 41L Floyd St
- 947 Pearl Lake Rd
- 439 Piedmont St
- 21 Whittlesey Ave
- 335 Raymond St
- 242 Madison St
- 44 Shadybrook Ln
- 273 Piedmont St
- 00 Milton Ave
- 170 Purdy Rd
- 89 Rockledge Dr
- 60 Gayfield Rd
- 35 Mountain Village Rd Unit 30
- 463 Pearl Lake Rd
- 1135 Hamilton Ave
- 40 Laval St