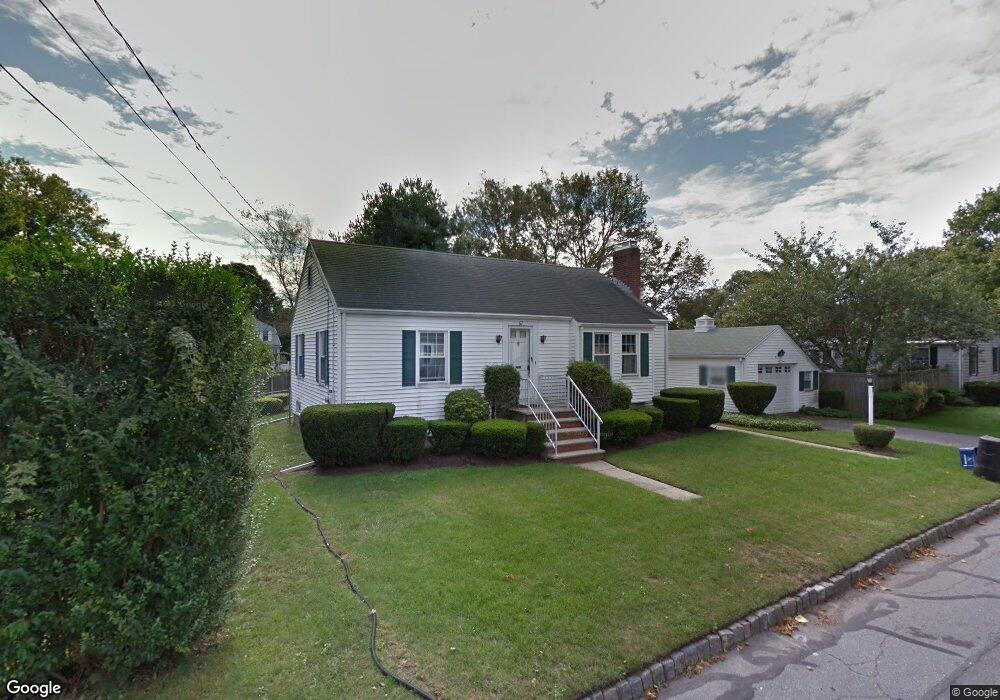
67 Massasoit Ave Fairhaven, MA 02719
Oxford NeighborhoodEstimated Value: $413,243 - $446,000
2
Beds
1
Bath
935
Sq Ft
$462/Sq Ft
Est. Value
About This Home
This home is located at 67 Massasoit Ave, Fairhaven, MA 02719 and is currently estimated at $431,561, approximately $461 per square foot. 67 Massasoit Ave is a home located in Bristol County with nearby schools including Fairhaven High School, Alma Del Mar Charter School, and City On A Hill Charter Public School New Bedford.
Ownership History
Date
Name
Owned For
Owner Type
Purchase Details
Closed on
Mar 22, 2016
Sold by
Giamalvo Paul and Giamalvo Susan J
Bought by
Giammalvo Michael P and Giammalvo Bethany
Current Estimated Value
Home Financials for this Owner
Home Financials are based on the most recent Mortgage that was taken out on this home.
Original Mortgage
$180,000
Outstanding Balance
$142,800
Interest Rate
3.72%
Mortgage Type
New Conventional
Estimated Equity
$288,761
Create a Home Valuation Report for This Property
The Home Valuation Report is an in-depth analysis detailing your home's value as well as a comparison with similar homes in the area
Home Values in the Area
Average Home Value in this Area
Purchase History
| Date | Buyer | Sale Price | Title Company |
|---|---|---|---|
| Giammalvo Michael P | $180,000 | -- |
Source: Public Records
Mortgage History
| Date | Status | Borrower | Loan Amount |
|---|---|---|---|
| Open | Giammalvo Michael P | $180,000 |
Source: Public Records
Tax History
| Year | Tax Paid | Tax Assessment Tax Assessment Total Assessment is a certain percentage of the fair market value that is determined by local assessors to be the total taxable value of land and additions on the property. | Land | Improvement |
|---|---|---|---|---|
| 2025 | $34 | $367,300 | $181,100 | $186,200 |
| 2024 | $3,226 | $349,500 | $181,100 | $168,400 |
| 2023 | $3,176 | $319,200 | $167,900 | $151,300 |
| 2022 | $3,052 | $298,600 | $159,900 | $138,700 |
| 2021 | $2,890 | $256,000 | $145,400 | $110,600 |
| 2020 | $3,478 | $249,400 | $138,800 | $110,600 |
| 2019 | $2,738 | $234,600 | $126,400 | $108,200 |
| 2018 | $3,088 | $222,700 | $120,300 | $102,400 |
| 2017 | $2,879 | $216,900 | $120,300 | $96,600 |
| 2016 | $2,585 | $212,200 | $120,300 | $91,900 |
| 2015 | $2,556 | $210,400 | $120,300 | $90,100 |
Source: Public Records
Map
Nearby Homes
- 15 School St
- 16 Ash St
- 24 Academy Ave
- 67 Bridge St
- 138 Main St Unit 13
- 39 Christian St
- 77 Adams St
- 442 Dana Farms
- 145 Pleasant St
- 313 Main St
- 58 Washington St
- 0 Nulands Neck Unit 73286360
- 253 Adams St
- 8 Washington St
- 14 Sycamore St
- 10 Livesey Pkwy
- 24 Middle St
- 181 Washington St
- 71 Sycamore St
- 8 Manor Dr
Your Personal Tour Guide
Ask me questions while you tour the home.