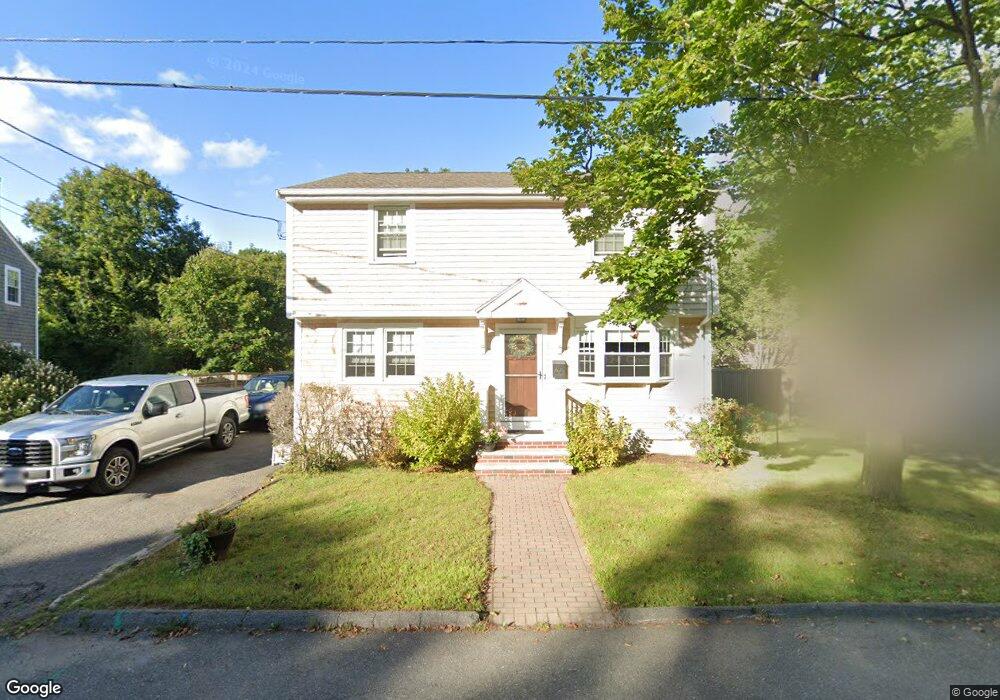
67 Maverick St Marblehead, MA 01945
Estimated Value: $782,000 - $986,270
4
Beds
2
Baths
2,172
Sq Ft
$420/Sq Ft
Est. Value
About This Home
This home is located at 67 Maverick St, Marblehead, MA 01945 and is currently estimated at $911,818, approximately $419 per square foot. 67 Maverick St is a home located in Essex County with nearby schools including Marblehead High School, Marblehead Community Charter Public School, and Devereux School.
Ownership History
Date
Name
Owned For
Owner Type
Purchase Details
Closed on
Aug 30, 2007
Sold by
Burke Gregory and Schachere-Burke Michele
Bought by
Bovill Robert T
Current Estimated Value
Purchase Details
Closed on
Jun 26, 1997
Sold by
Jastrzebski Ft
Bought by
Burke Gregory
Create a Home Valuation Report for This Property
The Home Valuation Report is an in-depth analysis detailing your home's value as well as a comparison with similar homes in the area
Home Values in the Area
Average Home Value in this Area
Purchase History
| Date | Buyer | Sale Price | Title Company |
|---|---|---|---|
| Bovill Robert T | $365,000 | -- | |
| Bovill Robert T | $365,000 | -- | |
| Burke Gregory | $215,000 | -- | |
| Burke Gregory | $215,000 | -- |
Source: Public Records
Mortgage History
| Date | Status | Borrower | Loan Amount |
|---|---|---|---|
| Open | Burke Gregory | $299,000 | |
| Closed | Burke Gregory | $308,000 |
Source: Public Records
Tax History Compared to Growth
Tax History
| Year | Tax Paid | Tax Assessment Tax Assessment Total Assessment is a certain percentage of the fair market value that is determined by local assessors to be the total taxable value of land and additions on the property. | Land | Improvement |
|---|---|---|---|---|
| 2025 | $8,159 | $901,600 | $519,500 | $382,100 |
| 2024 | $7,768 | $867,000 | $496,500 | $370,500 |
| 2023 | $7,747 | $774,700 | $473,400 | $301,300 |
| 2022 | $7,178 | $682,300 | $386,800 | $295,500 |
| 2021 | $6,394 | $613,600 | $369,500 | $244,100 |
| 2020 | $6,262 | $602,700 | $369,500 | $233,200 |
| 2019 | $5,995 | $558,200 | $334,800 | $223,400 |
| 2018 | $5,897 | $535,100 | $311,700 | $223,400 |
| 2017 | $5,511 | $500,500 | $277,100 | $223,400 |
| 2016 | $4,995 | $450,000 | $265,500 | $184,500 |
| 2015 | $4,900 | $442,200 | $254,000 | $188,200 |
| 2014 | $4,392 | $396,000 | $219,400 | $176,600 |
Source: Public Records
Map
Nearby Homes
- 70 Maverick St
- 6 Higgins Rd
- 100 Village St
- 29 Village St Unit 1
- 12 Heritage Way Unit 12
- 282 Pleasant St
- 197A W Shore Dr Unit A
- 41 Rowland St
- 215 W Shore Dr
- 30 Amherst Rd
- 155 Village St
- 66 Jersey St
- 290 Washington St Unit 3
- 290 Washington St Unit 2
- 290 Washington St Unit 1
- 19 Linden St
- 34 Lafayette St
- 87 Jersey St
- 10 Shepard St
- 41 Atlantic Ave Unit 1