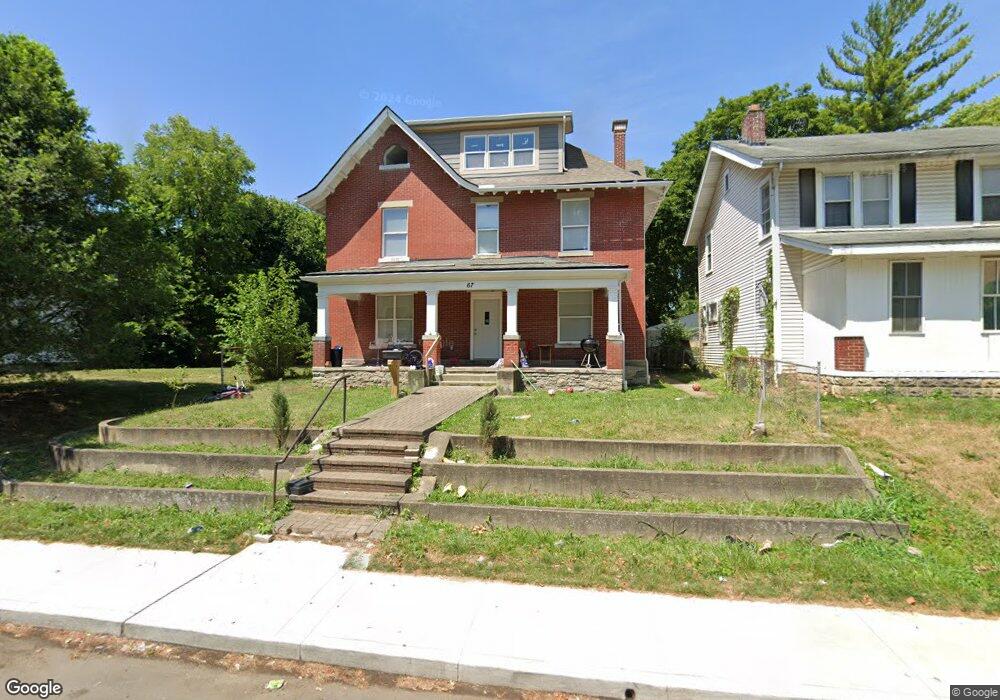
67 Midland Ave Columbus, OH 43223
Central Hilltop NeighborhoodEstimated Value: $214,000 - $264,000
5
Beds
3
Baths
3,256
Sq Ft
$73/Sq Ft
Est. Value
About This Home
This home is located at 67 Midland Ave, Columbus, OH 43223 and is currently estimated at $237,418, approximately $72 per square foot. 67 Midland Ave is a home located in Franklin County with nearby schools including Highland Elementary School, Westmoor Middle School, and West High School.
Ownership History
Date
Name
Owned For
Owner Type
Purchase Details
Closed on
Feb 7, 2022
Sold by
Horton David M
Bought by
Yadaicela Oscar Alfonso Morq
Current Estimated Value
Purchase Details
Closed on
Feb 1, 2022
Sold by
Horton David M
Bought by
Yadaicela Oscar Alfonso Morq
Purchase Details
Closed on
Jul 3, 2017
Sold by
Hix Carla R
Bought by
Horton David M
Purchase Details
Closed on
Nov 21, 2000
Sold by
Federal Home Loan Mortgage Corporation
Bought by
Hix Carla R
Home Financials for this Owner
Home Financials are based on the most recent Mortgage that was taken out on this home.
Original Mortgage
$48,450
Interest Rate
7.7%
Purchase Details
Closed on
Feb 10, 2000
Sold by
Garred Loretta M
Bought by
Federal Home Loan Mortgage Corporation
Purchase Details
Closed on
Dec 8, 1993
Bought by
Garred Loretta M
Purchase Details
Closed on
Sep 28, 1992
Purchase Details
Closed on
Oct 1, 1983
Create a Home Valuation Report for This Property
The Home Valuation Report is an in-depth analysis detailing your home's value as well as a comparison with similar homes in the area
Home Values in the Area
Average Home Value in this Area
Purchase History
| Date | Buyer | Sale Price | Title Company |
|---|---|---|---|
| Yadaicela Oscar Alfonso Morq | $39,000 | New Title Company Name | |
| Yadaicela Oscar Alfonso Morq | $39,000 | New Title Company Name | |
| Horton David M | $66,800 | None Available | |
| Hix Carla R | -- | Midland Celtic Title | |
| Federal Home Loan Mortgage Corporation | $48,600 | -- | |
| Garred Loretta M | $75,000 | -- | |
| -- | $47,000 | -- | |
| -- | -- | -- |
Source: Public Records
Mortgage History
| Date | Status | Borrower | Loan Amount |
|---|---|---|---|
| Previous Owner | Hix Carla R | $48,450 |
Source: Public Records
Tax History
| Year | Tax Paid | Tax Assessment Tax Assessment Total Assessment is a certain percentage of the fair market value that is determined by local assessors to be the total taxable value of land and additions on the property. | Land | Improvement |
|---|---|---|---|---|
| 2025 | $6,257 | $80,710 | $6,440 | $74,270 |
| 2024 | $6,257 | $80,710 | $6,440 | $74,270 |
| 2023 | $3,858 | $80,710 | $6,440 | $74,270 |
| 2022 | $2,550 | $31,510 | $2,210 | $29,300 |
| 2021 | $1,757 | $31,510 | $2,210 | $29,300 |
| 2020 | $1,888 | $31,510 | $2,210 | $29,300 |
| 2019 | $1,873 | $25,730 | $1,860 | $23,870 |
| 2018 | $1,658 | $25,730 | $1,860 | $23,870 |
| 2017 | $1,906 | $25,730 | $1,860 | $23,870 |
| 2016 | $1,743 | $23,380 | $4,550 | $18,830 |
| 2015 | $1,557 | $23,380 | $4,550 | $18,830 |
| 2014 | $1,409 | $23,380 | $4,550 | $18,830 |
| 2013 | $892 | $27,510 | $5,355 | $22,155 |
Source: Public Records
Map
Nearby Homes
- 107 Midland Ave Unit 107-109
- 34-36 Midland Ave
- 137 Clarendon Ave
- 83 Belvidere Ave
- 45 Belvidere Ave
- 172 Whitethorne Ave
- 66 S Wheatland Ave
- 178 Belvidere Ave
- 244 Clarendon Ave
- 249 Midland Ave
- 196 Belvidere Ave
- 126 S Oakley Ave
- 204 S Wheatland Ave
- 225 S Highland Ave
- 83 Lechner Ave
- 27 S Oakley Ave
- 265-267 Belvidere Ave
- 1936 Floral Ave
- 302 S Highland Ave Unit 306
- 151 S Wayne Ave Unit 153
- 63 Midland Ave
- 73 Midland Ave Unit 75
- 73-75 Midland Ave Unit 1
- 73-75 Midland Ave
- 59 Midland Ave
- 79 Midland Ave Unit 81
- 79-81 Midland Ave
- 85 Midland Ave
- 68 Clarendon Ave
- 62 Clarendon Ave
- 72 Clarendon Ave Unit 74
- 58 Clarendon Ave
- 89 Midland Ave
- 80 Clarendon Ave
- 68 Midland Ave
- 64 Midland Ave
- 72-74 Clarendon Ave
- 74 Midland Ave Unit 76
- 52 Clarendon Ave
- 58 Midland Ave
Your Personal Tour Guide
Ask me questions while you tour the home.