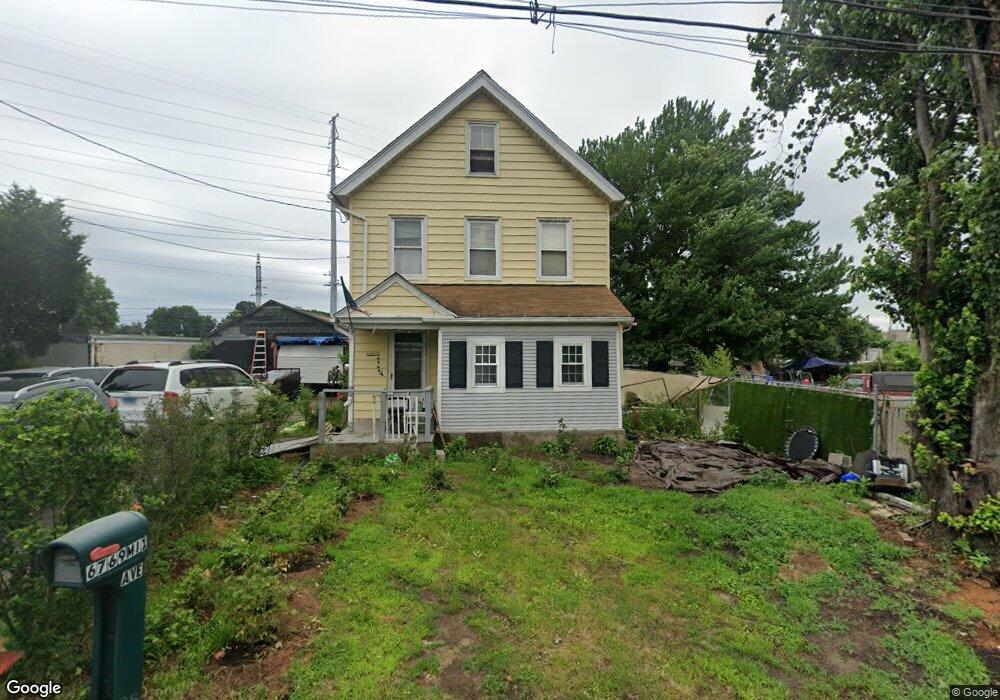
67 Mix Ave West Haven, CT 06516
West Haven Center NeighborhoodEstimated Value: $165,000 - $311,000
2
Beds
2
Baths
1,184
Sq Ft
$220/Sq Ft
Est. Value
About This Home
This home is located at 67 Mix Ave, West Haven, CT 06516 and is currently estimated at $260,719, approximately $220 per square foot. 67 Mix Ave is a home located in New Haven County with nearby schools including Carrigan 5/6 Intermediate School, Harry M. Bailey Middle School, and West Haven High School.
Ownership History
Date
Name
Owned For
Owner Type
Purchase Details
Closed on
Sep 9, 2020
Sold by
Golembiewski Joseph H
Bought by
Morales Nilda A
Current Estimated Value
Purchase Details
Closed on
Apr 13, 2015
Sold by
Golembiewski Joseph
Bought by
Morales Adel
Purchase Details
Closed on
Mar 17, 2015
Sold by
Sheila Thomas Est and Sawyer
Bought by
Golembiewski Joseph
Create a Home Valuation Report for This Property
The Home Valuation Report is an in-depth analysis detailing your home's value as well as a comparison with similar homes in the area
Home Values in the Area
Average Home Value in this Area
Purchase History
| Date | Buyer | Sale Price | Title Company |
|---|---|---|---|
| Morales Nilda A | -- | None Available | |
| Morales Nilda A | -- | None Available | |
| Morales Adel | -- | -- | |
| Golembiewski Joseph | $78,000 | -- | |
| Morales Adel | -- | -- | |
| Golembiewski Joseph | $78,000 | -- |
Source: Public Records
Tax History Compared to Growth
Tax History
| Year | Tax Paid | Tax Assessment Tax Assessment Total Assessment is a certain percentage of the fair market value that is determined by local assessors to be the total taxable value of land and additions on the property. | Land | Improvement |
|---|---|---|---|---|
| 2025 | $4,617 | $133,700 | $51,240 | $82,460 |
| 2024 | $4,116 | $84,840 | $35,490 | $49,350 |
| 2023 | $3,946 | $84,840 | $35,490 | $49,350 |
| 2022 | $3,869 | $84,840 | $35,490 | $49,350 |
| 2021 | $3,869 | $84,840 | $35,490 | $49,350 |
| 2020 | $3,611 | $71,540 | $27,860 | $43,680 |
| 2019 | $3,482 | $71,540 | $27,860 | $43,680 |
| 2018 | $3,452 | $71,540 | $27,860 | $43,680 |
| 2017 | $3,267 | $71,540 | $27,860 | $43,680 |
| 2016 | $3,259 | $71,540 | $27,860 | $43,680 |
| 2015 | $3,339 | $82,740 | $32,900 | $49,840 |
| 2014 | $3,318 | $82,740 | $32,900 | $49,840 |
Source: Public Records
Map
Nearby Homes
- 22 Thill St
- 25 Richards St
- 43 Clifton St
- 170 Wood St
- 484 1st Ave Unit 6
- 682 2nd Ave
- 28 Wharton St
- 677 Washington Ave
- 941 Campbell Ave
- 24 George St
- 246 Elm St
- 29 Abner St
- 211 Kimberly Ave
- 1014 Campbell Ave Unit 14
- 196 Center St
- 82 Main St
- 194 Ella T Grasso Blvd
- 285 Main St
- 133 Plymouth St
- 14 Homestead Ave