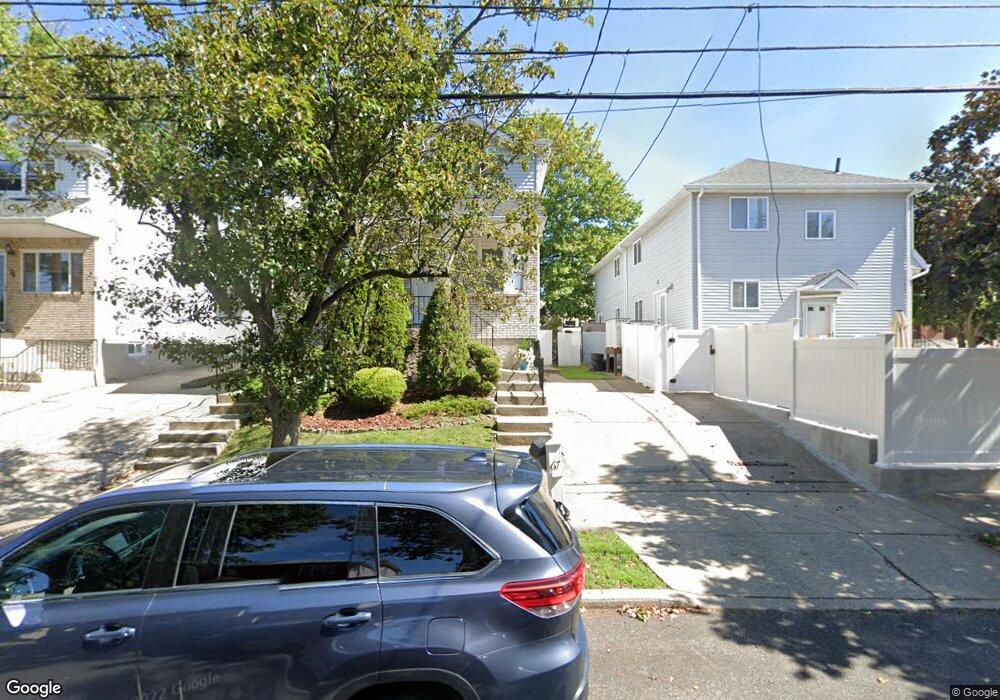
67 Mobile Ave Staten Island, NY 10306
New Dorp NeighborhoodEstimated Value: $693,000 - $728,000
3
Beds
3
Baths
1,710
Sq Ft
$417/Sq Ft
Est. Value
About This Home
This home is located at 67 Mobile Ave, Staten Island, NY 10306 and is currently estimated at $713,713, approximately $417 per square foot. 67 Mobile Ave is a home located in Richmond County with nearby schools including P.S. 23 Richmondtown, Myra S. Barnes Intermediate School 24, and New Dorp High School.
Ownership History
Date
Name
Owned For
Owner Type
Purchase Details
Closed on
Jul 29, 2005
Sold by
Bloise Albert and Bloise Denise
Bought by
Messana Gregory and Messana Lorraine
Current Estimated Value
Home Financials for this Owner
Home Financials are based on the most recent Mortgage that was taken out on this home.
Original Mortgage
$330,000
Outstanding Balance
$173,576
Interest Rate
5.68%
Mortgage Type
Fannie Mae Freddie Mac
Estimated Equity
$540,137
Create a Home Valuation Report for This Property
The Home Valuation Report is an in-depth analysis detailing your home's value as well as a comparison with similar homes in the area
Home Values in the Area
Average Home Value in this Area
Purchase History
| Date | Buyer | Sale Price | Title Company |
|---|---|---|---|
| Messana Gregory | $425,000 | Lawyers Title Ins |
Source: Public Records
Mortgage History
| Date | Status | Borrower | Loan Amount |
|---|---|---|---|
| Open | Messana Gregory | $330,000 |
Source: Public Records
Tax History Compared to Growth
Tax History
| Year | Tax Paid | Tax Assessment Tax Assessment Total Assessment is a certain percentage of the fair market value that is determined by local assessors to be the total taxable value of land and additions on the property. | Land | Improvement |
|---|---|---|---|---|
| 2025 | $5,706 | $37,620 | $6,047 | $31,573 |
| 2024 | $5,718 | $34,800 | $6,167 | $28,633 |
| 2023 | $5,769 | $29,808 | $5,222 | $24,586 |
| 2022 | $5,655 | $36,540 | $7,200 | $29,340 |
| 2021 | $5,515 | $32,340 | $7,200 | $25,140 |
| 2020 | $5,277 | $33,960 | $7,200 | $26,760 |
| 2019 | $4,903 | $34,800 | $7,200 | $27,600 |
| 2018 | $4,766 | $24,840 | $6,494 | $18,346 |
| 2017 | $4,679 | $24,422 | $7,062 | $17,360 |
| 2016 | $4,296 | $23,040 | $6,117 | $16,923 |
| 2015 | $3,668 | $21,942 | $5,300 | $16,642 |
| 2014 | $3,668 | $20,700 | $6,000 | $14,700 |
Source: Public Records
Map
Nearby Homes