67 Monarch Rd Ellijay, GA 30540
Estimated Value: $402,000 - $455,000
3
Beds
3
Baths
1,384
Sq Ft
$306/Sq Ft
Est. Value
About This Home
This home is located at 67 Monarch Rd, Ellijay, GA 30540 and is currently estimated at $423,226, approximately $305 per square foot. 67 Monarch Rd is a home located in Gilmer County with nearby schools including Mountain View Elementary School, Gilmer Middle School, and Clear Creek Middle School.
Ownership History
Date
Name
Owned For
Owner Type
Purchase Details
Closed on
Oct 26, 2006
Sold by
Sheeter Magdalene
Bought by
Sheeter Magdalene and Sheeter Larry
Current Estimated Value
Purchase Details
Closed on
Jul 28, 2006
Sold by
Sheeter Magdalene
Bought by
Sheeter Magdalene and Sheeter Larry
Home Financials for this Owner
Home Financials are based on the most recent Mortgage that was taken out on this home.
Original Mortgage
$171,500
Outstanding Balance
$117,948
Interest Rate
9.63%
Mortgage Type
New Conventional
Estimated Equity
$305,278
Purchase Details
Closed on
Dec 11, 2003
Sold by
Waters Michael G and Waters Jeannine
Bought by
Edwards Donald B
Purchase Details
Closed on
Jun 18, 2001
Sold by
Hansen Mary D
Bought by
Waters Michael G and Waters Jea
Purchase Details
Closed on
Jun 23, 2000
Sold by
Cruthis Sanford Buil
Bought by
Hansen Mary D
Purchase Details
Closed on
Mar 22, 1999
Sold by
Miller Doug and Miller Nina
Bought by
Cruthis Sanford Buil
Create a Home Valuation Report for This Property
The Home Valuation Report is an in-depth analysis detailing your home's value as well as a comparison with similar homes in the area
Home Values in the Area
Average Home Value in this Area
Purchase History
| Date | Buyer | Sale Price | Title Company |
|---|---|---|---|
| Sheeter Magdalene | -- | -- | |
| Sheeter Magdalene | -- | -- | |
| Sheeter Magdalene | $171,500 | -- | |
| Edwards Donald B | $125,000 | -- | |
| Waters Michael G | $105,000 | -- | |
| Hansen Mary D | $90,700 | -- | |
| Cruthis Sanford Buil | $4,000 | -- |
Source: Public Records
Mortgage History
| Date | Status | Borrower | Loan Amount |
|---|---|---|---|
| Open | Sheeter Magdalene | $171,500 |
Source: Public Records
Tax History Compared to Growth
Tax History
| Year | Tax Paid | Tax Assessment Tax Assessment Total Assessment is a certain percentage of the fair market value that is determined by local assessors to be the total taxable value of land and additions on the property. | Land | Improvement |
|---|---|---|---|---|
| 2024 | $2,172 | $140,160 | $3,400 | $136,760 |
| 2023 | $2,054 | $128,400 | $2,920 | $125,480 |
| 2022 | $1,940 | $110,240 | $2,000 | $108,240 |
| 2021 | $1,537 | $77,440 | $2,000 | $75,440 |
| 2020 | $1,319 | $59,960 | $1,920 | $58,040 |
| 2019 | $1,352 | $59,720 | $1,680 | $58,040 |
| 2018 | $1,269 | $55,320 | $1,680 | $53,640 |
| 2017 | $1,152 | $46,840 | $2,000 | $44,840 |
| 2016 | $1,203 | $47,920 | $2,000 | $45,920 |
| 2015 | $1,052 | $42,680 | $1,800 | $40,880 |
| 2014 | $993 | $38,760 | $1,800 | $36,960 |
| 2013 | -- | $39,600 | $1,800 | $37,800 |
Source: Public Records
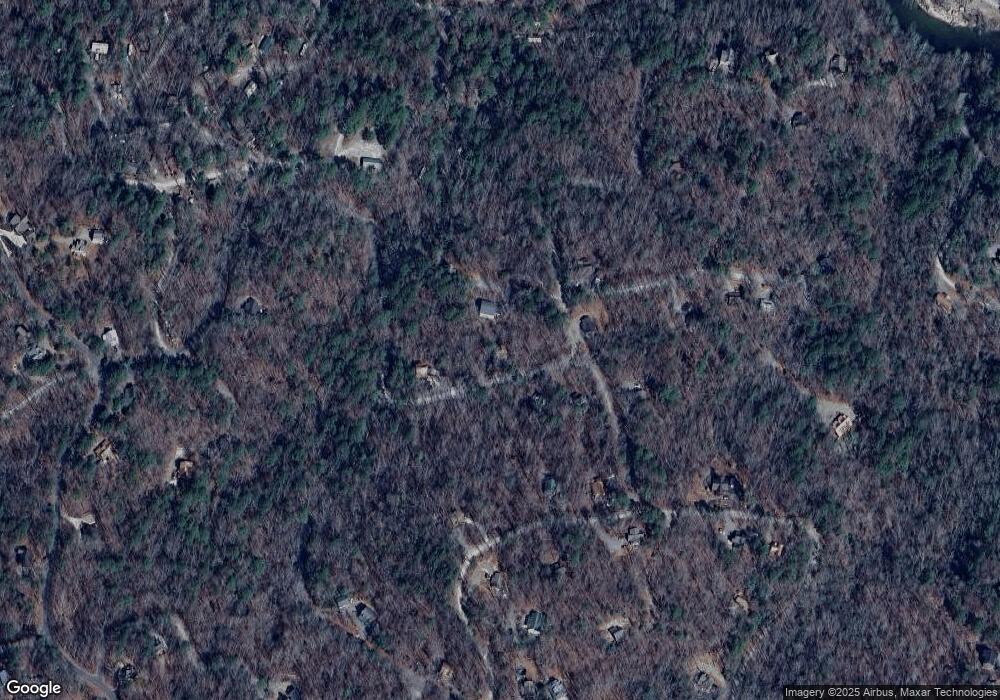
Map
Nearby Homes
- 67 Monarch Dr
- 2815 Monarch Dr
- 31 Gunite Ln
- 37 Monarch Rd Unit 9146
- 0 Monarch Dr Unit 8200692
- 0 Monarch Dr
- 100 Monarch Dr
- 37 Monarch Dr Unit 2841
- 37 Monarch Dr
- 57 Gunite Ln
- 0
- 108 Gunite Cir
- 596 Gunite Cir
- 596 Gunite Cir Unit 2868
- 2811 Morley Ct
- 2809 Morley Ct
- 2884 Morley Ct
- 511 Medina Ct
- LOT 2826 Gunite Dr
- 2811 Morely Ct