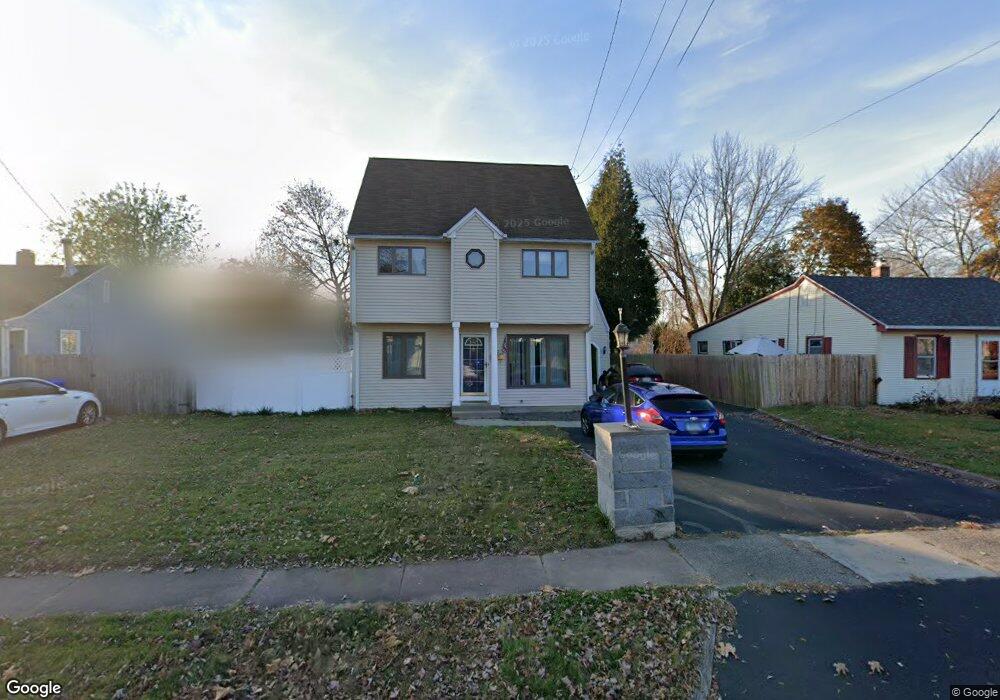
67 Naubuc Ave East Hartford, CT 06118
Estimated Value: $349,000 - $378,990
3
Beds
3
Baths
2,280
Sq Ft
$160/Sq Ft
Est. Value
About This Home
This home is located at 67 Naubuc Ave, East Hartford, CT 06118 and is currently estimated at $364,498, approximately $159 per square foot. 67 Naubuc Ave is a home located in Hartford County with nearby schools including East Hartford Middle School and East Hartford High School.
Ownership History
Date
Name
Owned For
Owner Type
Purchase Details
Closed on
Jan 26, 2007
Sold by
Rio Amy F and Carter William M
Bought by
Chuchro Adam
Current Estimated Value
Home Financials for this Owner
Home Financials are based on the most recent Mortgage that was taken out on this home.
Original Mortgage
$204,400
Outstanding Balance
$122,359
Interest Rate
6.15%
Estimated Equity
$242,139
Create a Home Valuation Report for This Property
The Home Valuation Report is an in-depth analysis detailing your home's value as well as a comparison with similar homes in the area
Home Values in the Area
Average Home Value in this Area
Purchase History
| Date | Buyer | Sale Price | Title Company |
|---|---|---|---|
| Chuchro Adam | $255,500 | -- |
Source: Public Records
Mortgage History
| Date | Status | Borrower | Loan Amount |
|---|---|---|---|
| Closed | Chuchro Adam | $35,000 | |
| Open | Chuchro Adam | $204,400 | |
| Closed | Chuchro Adam | $38,325 |
Source: Public Records
Tax History Compared to Growth
Tax History
| Year | Tax Paid | Tax Assessment Tax Assessment Total Assessment is a certain percentage of the fair market value that is determined by local assessors to be the total taxable value of land and additions on the property. | Land | Improvement |
|---|---|---|---|---|
| 2025 | $7,333 | $159,760 | $37,110 | $122,650 |
| 2024 | $7,029 | $159,760 | $37,110 | $122,650 |
| 2023 | $6,796 | $159,760 | $37,110 | $122,650 |
| 2022 | $6,550 | $159,760 | $37,110 | $122,650 |
| 2021 | $5,852 | $118,590 | $28,120 | $90,470 |
| 2020 | $5,920 | $118,590 | $28,120 | $90,470 |
| 2019 | $5,824 | $118,590 | $28,120 | $90,470 |
| 2018 | $5,652 | $118,590 | $28,120 | $90,470 |
| 2017 | $5,580 | $118,590 | $28,120 | $90,470 |
| 2016 | $5,419 | $118,160 | $28,120 | $90,040 |
| 2015 | $5,419 | $118,160 | $28,120 | $90,040 |
| 2014 | $5,364 | $118,160 | $28,120 | $90,040 |
Source: Public Records
Map
Nearby Homes