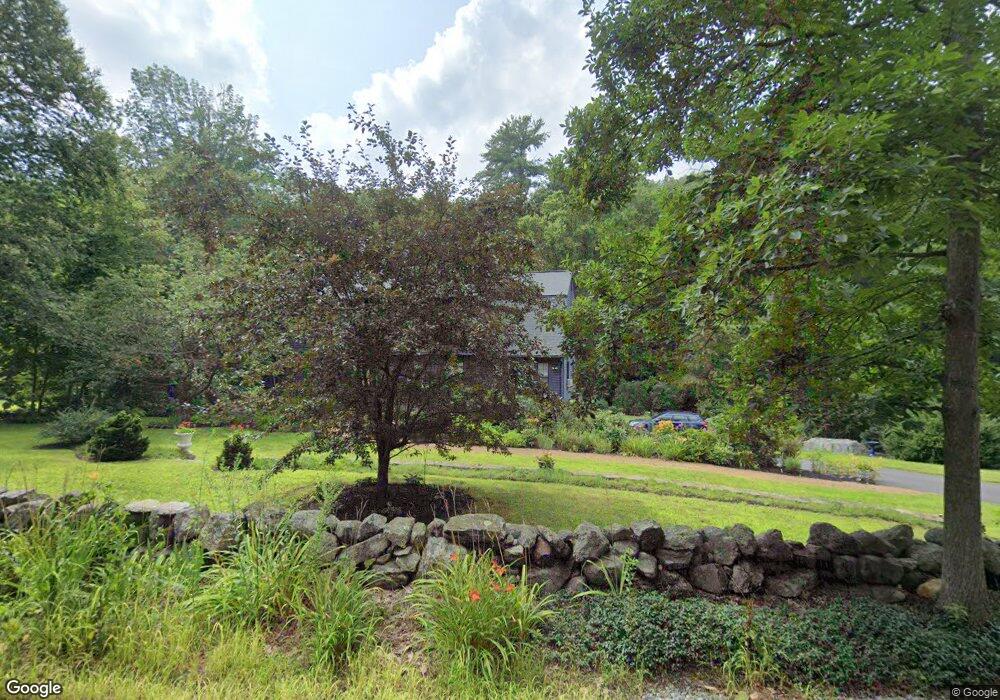
67 Newton St Northborough, MA 01532
Estimated Value: $750,142 - $886,000
5
Beds
3
Baths
2,247
Sq Ft
$364/Sq Ft
Est. Value
About This Home
This home is located at 67 Newton St, Northborough, MA 01532 and is currently estimated at $818,286, approximately $364 per square foot. 67 Newton St is a home located in Worcester County with nearby schools including Marion E. Zeh Elementary School, Robert E. Melican Middle School, and Algonquin Regional High School.
Ownership History
Date
Name
Owned For
Owner Type
Purchase Details
Closed on
Dec 22, 2021
Sold by
Miskinis Michael F and Miskinis Brenda M
Bought by
Int Miskinis
Current Estimated Value
Purchase Details
Closed on
Aug 19, 1999
Sold by
Choe Geon and Choe Jujung
Bought by
Miskinis Michael F and Miskinis Brenda M
Purchase Details
Closed on
Apr 18, 1997
Sold by
Heinrich George P and Heinrich Elizabeth F
Bought by
Choe Geon and Choe Jijung
Create a Home Valuation Report for This Property
The Home Valuation Report is an in-depth analysis detailing your home's value as well as a comparison with similar homes in the area
Home Values in the Area
Average Home Value in this Area
Purchase History
| Date | Buyer | Sale Price | Title Company |
|---|---|---|---|
| Int Miskinis | -- | None Available | |
| Miskinis Michael F | $295,000 | -- | |
| Choe Geon | $235,000 | -- |
Source: Public Records
Mortgage History
| Date | Status | Borrower | Loan Amount |
|---|---|---|---|
| Previous Owner | Choe Geon | $165,000 | |
| Previous Owner | Choe Geon | $211,000 |
Source: Public Records
Tax History Compared to Growth
Tax History
| Year | Tax Paid | Tax Assessment Tax Assessment Total Assessment is a certain percentage of the fair market value that is determined by local assessors to be the total taxable value of land and additions on the property. | Land | Improvement |
|---|---|---|---|---|
| 2025 | $9,719 | $682,000 | $315,400 | $366,600 |
| 2024 | $8,728 | $611,200 | $251,700 | $359,500 |
| 2023 | $8,315 | $562,200 | $237,300 | $324,900 |
| 2022 | $8,045 | $487,900 | $226,100 | $261,800 |
| 2021 | $7,728 | $451,400 | $205,700 | $245,700 |
| 2020 | $7,694 | $446,000 | $194,100 | $251,900 |
| 2019 | $7,263 | $423,500 | $188,500 | $235,000 |
| 2018 | $7,019 | $403,600 | $183,700 | $219,900 |
| 2017 | $6,904 | $397,000 | $183,700 | $213,300 |
| 2016 | $6,755 | $393,400 | $180,100 | $213,300 |
| 2015 | $6,640 | $396,900 | $191,100 | $205,800 |
| 2014 | $6,371 | $384,000 | $191,100 | $192,900 |
Source: Public Records
Map
Nearby Homes