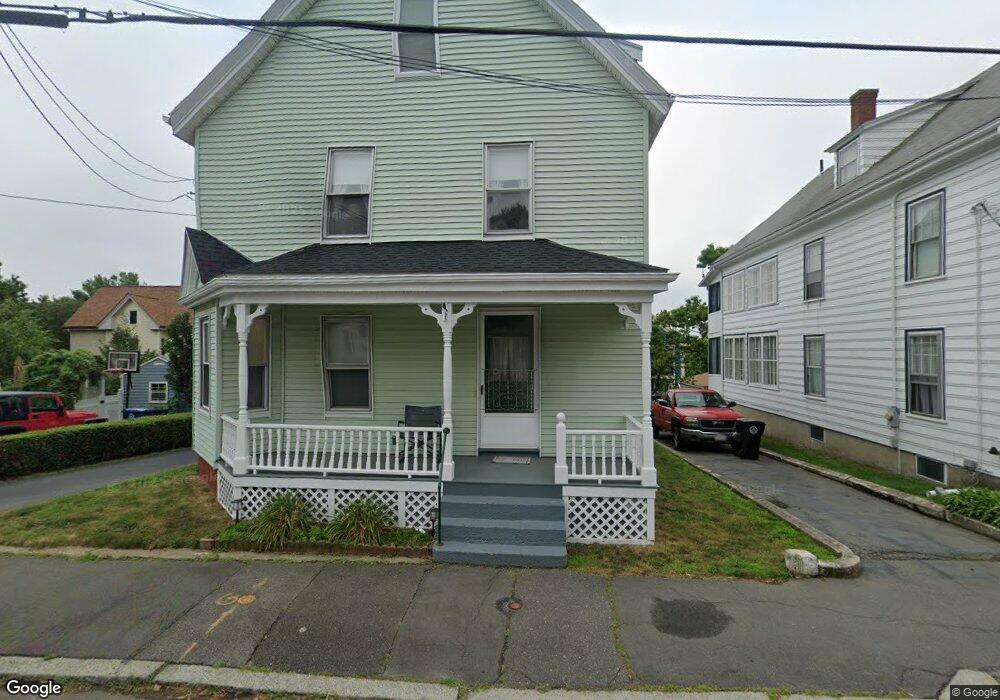
67 Ocean Ave Salem, MA 01970
South Salem NeighborhoodEstimated Value: $651,000 - $863,000
5
Beds
3
Baths
2,273
Sq Ft
$336/Sq Ft
Est. Value
About This Home
This home is located at 67 Ocean Ave, Salem, MA 01970 and is currently estimated at $763,802, approximately $336 per square foot. 67 Ocean Ave is a home located in Essex County with nearby schools including Saltonstall School, Horace Mann Laboratory, and Carlton Elementary School.
Ownership History
Date
Name
Owned For
Owner Type
Purchase Details
Closed on
Jul 30, 2012
Sold by
Guerrrette Lawrence R
Bought by
Lawrence R Guerrette S
Current Estimated Value
Purchase Details
Closed on
Aug 29, 2006
Sold by
Guerrette Irma M and Guerrette Lawrence R
Bought by
Guerrette Lawrence R
Home Financials for this Owner
Home Financials are based on the most recent Mortgage that was taken out on this home.
Original Mortgage
$50,000
Interest Rate
6.83%
Mortgage Type
Purchase Money Mortgage
Create a Home Valuation Report for This Property
The Home Valuation Report is an in-depth analysis detailing your home's value as well as a comparison with similar homes in the area
Home Values in the Area
Average Home Value in this Area
Purchase History
| Date | Buyer | Sale Price | Title Company |
|---|---|---|---|
| Lawrence R Guerrette S | -- | -- | |
| Guerrette Lawrence R | -- | -- |
Source: Public Records
Mortgage History
| Date | Status | Borrower | Loan Amount |
|---|---|---|---|
| Previous Owner | Guerrette Lawrence R | $50,000 | |
| Previous Owner | Guerrette Lawrence R | $49,000 |
Source: Public Records
Tax History Compared to Growth
Tax History
| Year | Tax Paid | Tax Assessment Tax Assessment Total Assessment is a certain percentage of the fair market value that is determined by local assessors to be the total taxable value of land and additions on the property. | Land | Improvement |
|---|---|---|---|---|
| 2025 | $6,688 | $589,800 | $172,500 | $417,300 |
| 2024 | $6,412 | $551,800 | $163,400 | $388,400 |
| 2023 | $6,209 | $496,300 | $151,300 | $345,000 |
| 2022 | $6,281 | $474,000 | $142,200 | $331,800 |
| 2021 | $6,115 | $443,100 | $142,200 | $300,900 |
| 2020 | $5,818 | $402,600 | $122,900 | $279,700 |
| 2019 | $5,774 | $382,400 | $116,800 | $265,600 |
| 2018 | $5,371 | $349,200 | $111,400 | $237,800 |
| 2017 | $4,988 | $314,500 | $90,800 | $223,700 |
| 2016 | $4,851 | $309,600 | $85,900 | $223,700 |
| 2015 | $4,703 | $286,600 | $77,500 | $209,100 |
Source: Public Records
Map
Nearby Homes
- 14 Meadow St
- 24 Wisteria St Unit 2
- 10 Hazel St Unit 2
- 4 Willow Ave Unit 2
- 327 Lafayette St Unit 2
- 2A Hazel St Unit 3
- 17 Cliff St
- 263 Jefferson Ave
- 9 Glover St Unit 1
- 9 Lyme St
- 7 Fairfield St
- 1 Laurent Rd Unit 3
- 10 Horton St
- 16 Leavitt St Unit 2
- 29 Willson St
- 25 Calabrese St
- 22 Calabrese St
- 288-292 Washington & 5 Porter St Ct
- 32 Park St
- 11 Sumner Rd
- 69 Ocean Ave
- 63 Ocean Ave
- 40 Linden St
- 6 Hersey St
- 71 Ocean Ave Unit 5
- 71 Ocean Ave Unit 4
- 71 Ocean Ave Unit 2
- 71 Ocean Ave Unit 1
- 71 Ocean Ave
- 44 Linden St
- 8 Hersey St Unit 3
- 8 Hersey St
- 8 Hersey St
- 66 Ocean Ave
- 73 Ocean Ave
- 36 Linden St
- 64 Ocean Ave
- 70 Ocean Ave
- 70 Ocean Ave Unit 2
- 10 Hersey St Unit 3