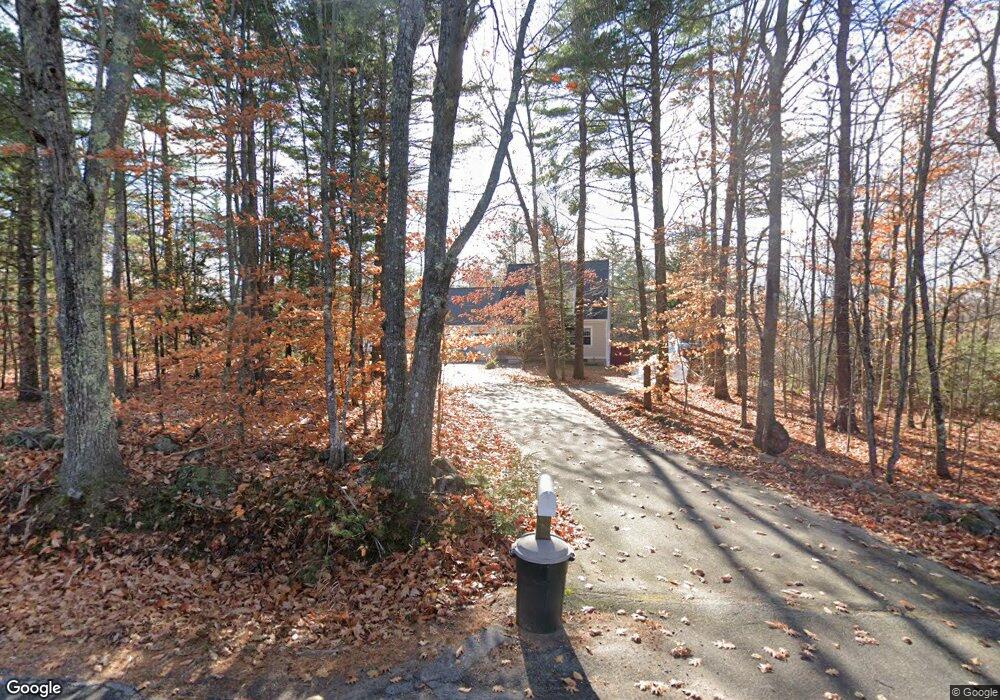
67 Old Limington Rd Cornish, ME 04020
Estimated Value: $423,898 - $516,000
3
Beds
2
Baths
2,122
Sq Ft
$220/Sq Ft
Est. Value
About This Home
This home is located at 67 Old Limington Rd, Cornish, ME 04020 and is currently estimated at $467,225, approximately $220 per square foot. 67 Old Limington Rd is a home located in York County.
Ownership History
Date
Name
Owned For
Owner Type
Purchase Details
Closed on
May 24, 2006
Sold by
Cye Charlene M and Carney Yvonne L
Bought by
Cyr Charlene M
Current Estimated Value
Home Financials for this Owner
Home Financials are based on the most recent Mortgage that was taken out on this home.
Original Mortgage
$235,000
Outstanding Balance
$135,620
Interest Rate
6.53%
Mortgage Type
Purchase Money Mortgage
Estimated Equity
$331,605
Create a Home Valuation Report for This Property
The Home Valuation Report is an in-depth analysis detailing your home's value as well as a comparison with similar homes in the area
Home Values in the Area
Average Home Value in this Area
Purchase History
| Date | Buyer | Sale Price | Title Company |
|---|---|---|---|
| Cyr Charlene M | -- | -- | |
| Cyr Charlene M | -- | -- | |
| Cyr Charlene M | -- | -- |
Source: Public Records
Mortgage History
| Date | Status | Borrower | Loan Amount |
|---|---|---|---|
| Open | Cyr Charlene M | $235,000 | |
| Closed | Cyr Charlene M | $235,000 |
Source: Public Records
Tax History
| Year | Tax Paid | Tax Assessment Tax Assessment Total Assessment is a certain percentage of the fair market value that is determined by local assessors to be the total taxable value of land and additions on the property. | Land | Improvement |
|---|---|---|---|---|
| 2025 | $3,737 | $395,400 | $77,300 | $318,100 |
| 2024 | $4,076 | $443,000 | $74,000 | $369,000 |
| 2023 | $3,794 | $265,300 | $41,900 | $223,400 |
| 2022 | $3,661 | $265,300 | $41,900 | $223,400 |
| 2021 | $3,582 | $265,300 | $41,900 | $223,400 |
| 2020 | $3,555 | $265,300 | $41,900 | $223,400 |
| 2019 | $3,555 | $265,300 | $41,900 | $223,400 |
| 2018 | $3,582 | $265,300 | $41,900 | $223,400 |
| 2016 | $3,420 | $265,300 | $41,900 | $223,400 |
| 2015 | $3,422 | $265,300 | $41,900 | $223,400 |
| 2014 | $3,678 | $285,100 | $41,900 | $243,200 |
Source: Public Records
Map
Nearby Homes
- Lot #11 Jordan Heights Rd
- Lot #4 Jordan Heights Rd
- Lot #3 Jordan Heights Rd
- Lot #2 Jordan Heights Rd
- Lot #8 Jordan Heights Rd
- 6-13 Main St
- 4 Bridge St
- 20 Main St
- 96 Maple St
- Lot #5 Jordan Heights Rd
- TBD Sokokis Trail N
- 50AC Sawyer Mountain Rd
- 198 Senator Black Rd
- 992 Pequawket Trail
- 0 Durgintown Rd
- 174 Marston Rd
- R13/038 Weeks Rd
- 60 Christian Hill Rd
- Lot 11 Quarry Rd
- 1783 North Rd
- 0 Seelye Dr Unit 1221540
- 0 Seelye Dr Unit 1221539
- 0 Seelye Dr Unit 1221541
- 0 Seelye Dr Unit 1018369
- 0 Seelye Dr Unit 1096623
- 00 Seelye Dr
- 1 Seelye Dr
- 84 Old Limington Rd
- 0 Seelye Rd Unit 273112
- 0 Seelye Rd Unit 197568
- 0 Seelye Rd Unit 1412912
- 0 Seelye Rd Unit 1288780
- 0 Seelye Rd Unit 1343931
- 9E Seelye Dr
- 9D Seelye Dr
- 27 Seelye Dr
- 32 Old Limington Rd
- 25 Orchard Dr
- 31 Seelye Rd
- 36 Seelye Dr
Your Personal Tour Guide
Ask me questions while you tour the home.