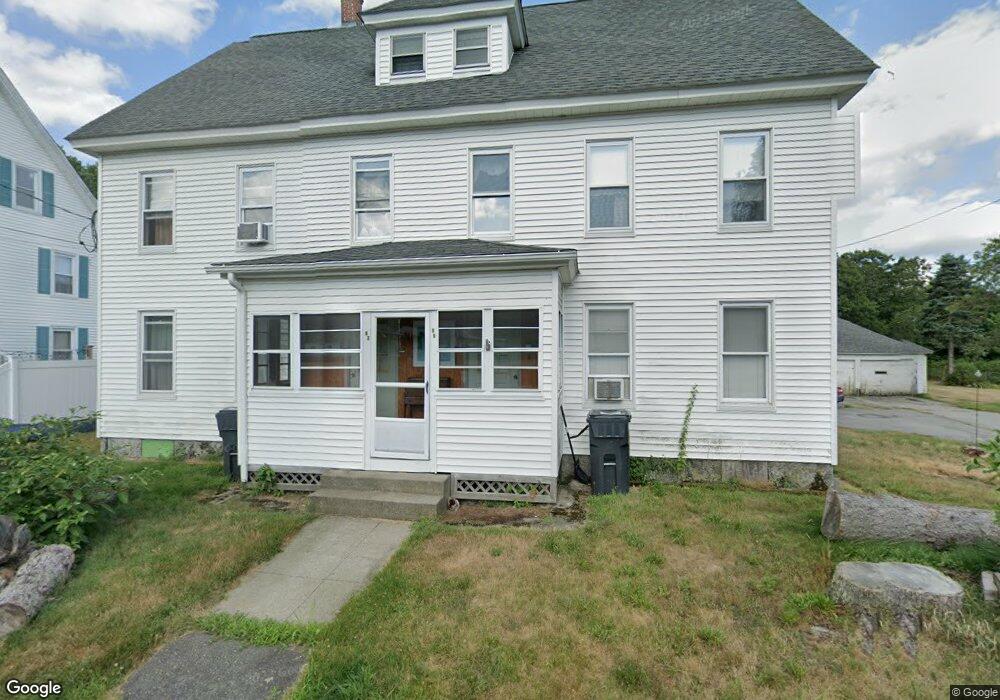
67 Orchard St South Grafton, MA 01560
Estimated Value: $393,000 - $599,000
6
Beds
2
Baths
2,384
Sq Ft
$212/Sq Ft
Est. Value
About This Home
This home is located at 67 Orchard St, South Grafton, MA 01560 and is currently estimated at $504,367, approximately $211 per square foot. 67 Orchard St is a home located in Worcester County with nearby schools including Grafton High School and Silver Spruce Montessori School.
Ownership History
Date
Name
Owned For
Owner Type
Purchase Details
Closed on
Dec 27, 2016
Sold by
Gasj Llc
Bought by
Rybicki
Current Estimated Value
Purchase Details
Closed on
May 13, 2009
Sold by
Rybicki Gary W and Rybicki Allan W
Bought by
Gasj Llc
Purchase Details
Closed on
May 18, 2005
Sold by
Rybicki Stella A
Bought by
Rybicki Allan W and Rybicki Gary W
Create a Home Valuation Report for This Property
The Home Valuation Report is an in-depth analysis detailing your home's value as well as a comparison with similar homes in the area
Home Values in the Area
Average Home Value in this Area
Purchase History
| Date | Buyer | Sale Price | Title Company |
|---|---|---|---|
| Rybicki | $235,000 | -- | |
| Rybicki | $235,000 | -- | |
| Rybicki | $235,000 | -- | |
| Gasj Llc | -- | -- | |
| Gasj Llc | -- | -- | |
| Gasj Llc | -- | -- | |
| Rybicki Allan W | -- | -- | |
| Rybicki Allan W | -- | -- | |
| Rybicki Allan W | -- | -- |
Source: Public Records
Tax History Compared to Growth
Tax History
| Year | Tax Paid | Tax Assessment Tax Assessment Total Assessment is a certain percentage of the fair market value that is determined by local assessors to be the total taxable value of land and additions on the property. | Land | Improvement |
|---|---|---|---|---|
| 2025 | $6,319 | $453,300 | $151,500 | $301,800 |
| 2024 | $6,073 | $424,400 | $144,300 | $280,100 |
| 2023 | $5,995 | $381,600 | $144,300 | $237,300 |
| 2022 | $5,501 | $325,900 | $123,900 | $202,000 |
| 2021 | $2,597 | $309,000 | $112,600 | $196,400 |
| 2020 | $4,637 | $281,000 | $112,600 | $168,400 |
| 2019 | $4,445 | $266,800 | $90,900 | $175,900 |
| 2018 | $2,181 | $262,300 | $89,900 | $172,400 |
| 2017 | $2,117 | $290,000 | $72,500 | $217,500 |
| 2016 | $4,685 | $279,700 | $85,300 | $194,400 |
| 2015 | $4,569 | $276,900 | $84,200 | $192,700 |
| 2014 | $4,019 | $263,400 | $94,200 | $169,200 |
Source: Public Records
Map
Nearby Homes
- 29 Sampson St Unit 29
- 55 Fisherville Terrace
- 44 Fisherville Terrace
- 58 Fisherville Terrace
- 109 Main St
- 110 Main St
- 7 Pine Hill Rd
- 191 Hartness Rd
- 90 Leland Hill Rd
- 185 Main St
- 50 Highland View Dr
- 150 Sprague St
- 19 Wildflower Dr
- 5 Wildflower Dr
- 29 Highland View Dr
- 151 Providence Rd Unit 24
- 12 Central Turnpike
- 395 Providence Rd Unit 4
- 86 Mikes Way Unit 86
- 84 Mikes Way Unit 84
- 65 Orchard St
- 71 Orchard St
- 62 Sampson St Unit 64
- 59 Orchard St Unit 61
- 64 Orchard St
- 72 Orchard St
- 55 Orchard St Unit 57
- 60 Sampson St
- 60 Sampson St
- 56 Orchard St
- 74 Orchard St
- 45 Ferry St
- 51 Orchard St Unit 53
- 2 Cabot St
- 54 Orchard St
- 45 Orchard St
- 45 Orchard St Unit 45 Orchard
- 47 Orchard St Unit 49
- 19 English Row
- 50 Orchard St