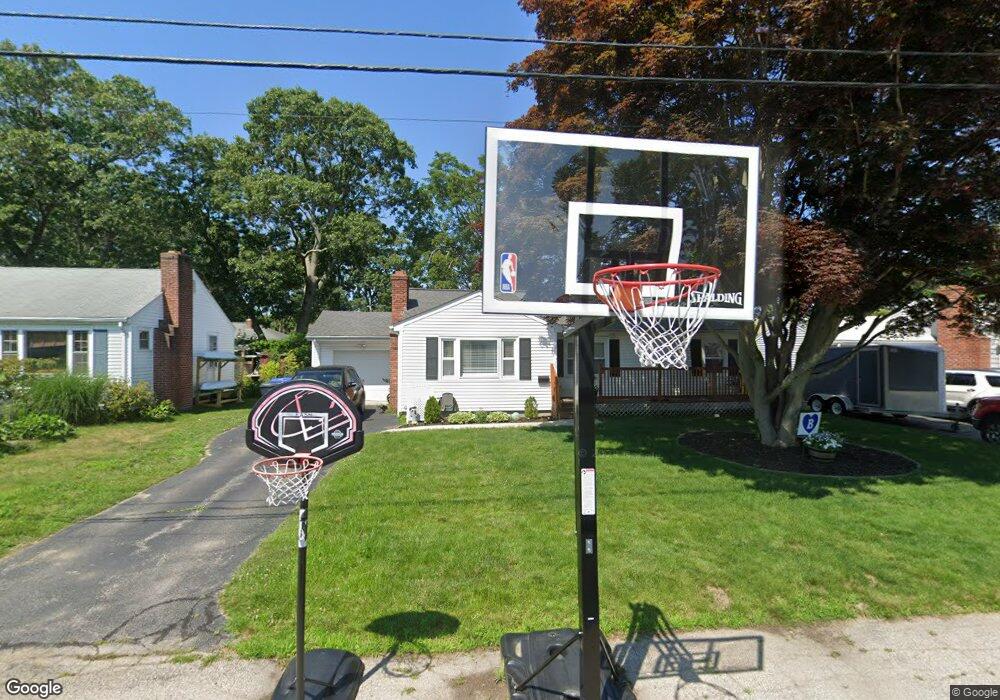
67 Palmer Ave Riverside, RI 02915
Riverside NeighborhoodEstimated Value: $428,000 - $479,000
3
Beds
1
Bath
1,130
Sq Ft
$393/Sq Ft
Est. Value
About This Home
This home is located at 67 Palmer Ave, Riverside, RI 02915 and is currently estimated at $444,384, approximately $393 per square foot. 67 Palmer Ave is a home located in Providence County with nearby schools including East Providence High School, St Luke Elementary School, and St Mary Academy-Bay View.
Ownership History
Date
Name
Owned For
Owner Type
Purchase Details
Closed on
Apr 15, 2019
Sold by
Mcgurn Kristal L and Mcgurn Donald
Bought by
Mcgurn Kristal L and Mcgurn Donald
Current Estimated Value
Home Financials for this Owner
Home Financials are based on the most recent Mortgage that was taken out on this home.
Original Mortgage
$190,400
Outstanding Balance
$166,709
Interest Rate
4.3%
Mortgage Type
New Conventional
Estimated Equity
$277,675
Create a Home Valuation Report for This Property
The Home Valuation Report is an in-depth analysis detailing your home's value as well as a comparison with similar homes in the area
Home Values in the Area
Average Home Value in this Area
Purchase History
| Date | Buyer | Sale Price | Title Company |
|---|---|---|---|
| Mcgurn Kristal L | -- | Vantage Point Title |
Source: Public Records
Mortgage History
| Date | Status | Borrower | Loan Amount |
|---|---|---|---|
| Open | Mcgurn Kristal L | $190,400 |
Source: Public Records
Tax History Compared to Growth
Tax History
| Year | Tax Paid | Tax Assessment Tax Assessment Total Assessment is a certain percentage of the fair market value that is determined by local assessors to be the total taxable value of land and additions on the property. | Land | Improvement |
|---|---|---|---|---|
| 2025 | $5,020 | $384,100 | $125,500 | $258,600 |
| 2024 | $5,094 | $332,300 | $104,600 | $227,700 |
| 2023 | $4,905 | $332,300 | $104,600 | $227,700 |
| 2022 | $4,746 | $217,100 | $56,400 | $160,700 |
| 2021 | $4,668 | $217,100 | $56,400 | $160,700 |
| 2020 | $4,470 | $217,100 | $56,400 | $160,700 |
| 2019 | $4,346 | $217,100 | $56,400 | $160,700 |
| 2018 | $4,237 | $185,200 | $54,800 | $130,400 |
| 2017 | $4,143 | $185,200 | $54,800 | $130,400 |
| 2016 | $4,123 | $185,200 | $54,800 | $130,400 |
| 2015 | $3,872 | $168,700 | $50,800 | $117,900 |
| 2014 | $3,872 | $168,700 | $50,800 | $117,900 |
Source: Public Records
Map
Nearby Homes
- 146 Becker Ave
- 6 Hilton Ave
- 25 Winslow St
- 735 Willett Ave Unit 806
- 81 Pine Crest Dr
- 83 Pine Crest Dr
- 85 Hilton Ave
- 25 Woodbine St
- 36 Woodbine St
- 536 Willett Ave
- 25 Read St
- 5 Booth Ave
- 46 Tanglewood Dr
- 140 Promenade St
- 210 Promenade St
- 74 Plum Rd
- 57 Harris St
- 6 Hazelton Rd
- 25 Park Square Ave
- 45 Washington Rd