67 Park St Shellman, GA 39886
Estimated Value: $120,000 - $234,000
2
Beds
2
Baths
1,440
Sq Ft
$125/Sq Ft
Est. Value
About This Home
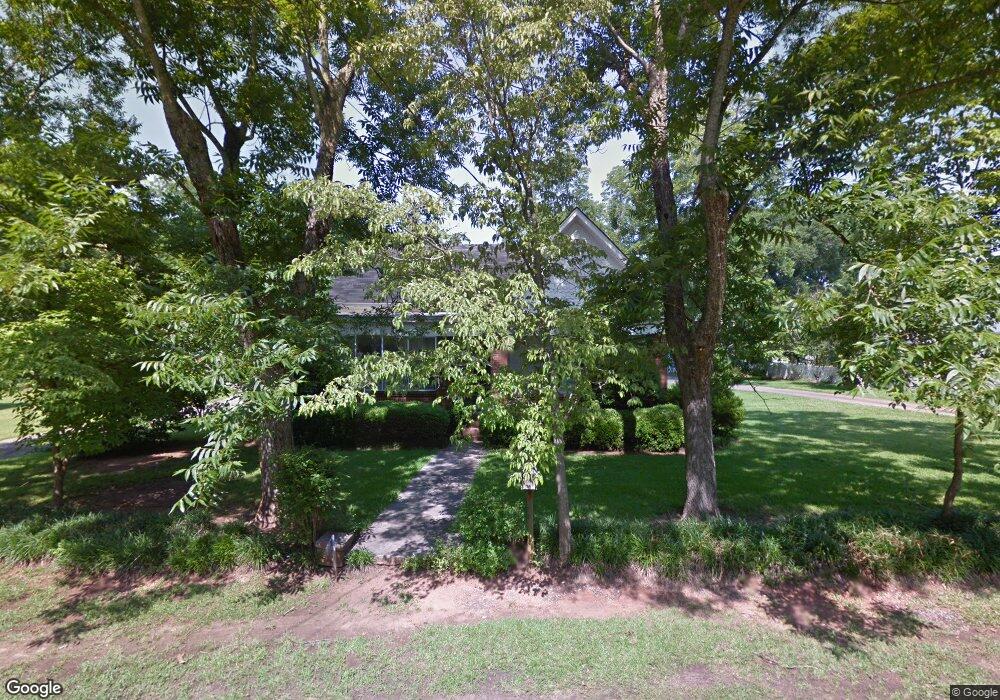
This home is located at 67 Park St, Shellman, GA 39886 and is currently estimated at $179,667, approximately $124 per square foot. 67 Park St is a home with nearby schools including Randolph County Elementary School, Randolph Clay Middle School, and Randolph Clay High School.
Ownership History
Date
Name
Owned For
Owner Type
Purchase Details
Closed on
Mar 26, 2025
Sold by
Lanier Ward Grant
Bought by
Bivens Thomas
Current Estimated Value
Home Financials for this Owner
Home Financials are based on the most recent Mortgage that was taken out on this home.
Original Mortgage
$181,818
Outstanding Balance
$180,050
Interest Rate
6.76%
Mortgage Type
New Conventional
Estimated Equity
-$383
Purchase Details
Closed on
Jul 2, 2021
Sold by
Saxon Mary Kathleen
Bought by
Ward Grant Lanier
Home Financials for this Owner
Home Financials are based on the most recent Mortgage that was taken out on this home.
Original Mortgage
$88,431
Interest Rate
2.9%
Mortgage Type
Commercial
Purchase Details
Closed on
May 10, 2021
Sold by
Salter Mary Jane
Bought by
Saxon Mary Kathleen
Home Financials for this Owner
Home Financials are based on the most recent Mortgage that was taken out on this home.
Original Mortgage
$88,431
Interest Rate
2.9%
Mortgage Type
Commercial
Purchase Details
Closed on
Feb 13, 2009
Sold by
Langford Paul P
Bought by
Salter Mary Jane
Purchase Details
Closed on
Aug 28, 1986
Sold by
Culberth Hilton R
Bought by
Culberth Gladys P
Create a Home Valuation Report for This Property
The Home Valuation Report is an in-depth analysis detailing your home's value as well as a comparison with similar homes in the area
Home Values in the Area
Average Home Value in this Area
Purchase History
| Date | Buyer | Sale Price | Title Company |
|---|---|---|---|
| Bivens Thomas | $180,000 | -- | |
| Ward Grant Lanier | $60,000 | -- | |
| Ward Grant Lanier | $60,000 | -- | |
| Saxon Mary Kathleen | -- | -- | |
| Saxon Mary Kathleen | -- | -- | |
| Salter Mary Jane | -- | -- | |
| Salter Mary Jane | -- | -- | |
| Langford Paul P | -- | -- | |
| Langford Paul P | -- | -- | |
| Culbreth Gladys P | -- | -- | |
| Culbreth Gladys P | -- | -- | |
| Culberth Gladys P | -- | -- |
Source: Public Records
Mortgage History
| Date | Status | Borrower | Loan Amount |
|---|---|---|---|
| Open | Bivens Thomas | $181,818 | |
| Previous Owner | Ward Grant Lanier | $88,431 |
Source: Public Records
Tax History
| Year | Tax Paid | Tax Assessment Tax Assessment Total Assessment is a certain percentage of the fair market value that is determined by local assessors to be the total taxable value of land and additions on the property. | Land | Improvement |
|---|---|---|---|---|
| 2025 | $2,486 | $49,328 | $2,440 | $46,888 |
| 2024 | $1,288 | $24,216 | $3,080 | $21,136 |
| 2023 | $1,079 | $24,216 | $3,080 | $21,136 |
| 2022 | $804 | $24,000 | $3,040 | $20,960 |
| 2021 | $317 | $18,232 | $2,938 | $15,294 |
| 2020 | $336 | $18,232 | $2,938 | $15,294 |
| 2019 | $334 | $18,232 | $2,938 | $15,294 |
| 2018 | $862 | $18,232 | $2,938 | $15,294 |
| 2017 | $303 | $18,232 | $2,938 | $15,294 |
| 2016 | $304 | $18,232 | $2,938 | $15,294 |
| 2015 | -- | $18,232 | $2,938 | $15,294 |
| 2014 | -- | $18,429 | $1,622 | $16,807 |
| 2013 | -- | $18,428 | $1,621 | $16,807 |
Source: Public Records
Map
Nearby Homes
- 3109 Calhoun St
- 0 Carver St
- 48 Cheney St
- 3845 Pearl St
- 8369 Graves Hwy
- Sam Bentley Rd
- Pierce Rd
- 0 Bird Song Rd
- 0 District Line Rd Unit 10518137
- 00 Hwy 41
- 13XX Graves Hwy
- 300 Five Forks Rd
- 145 Pearson Dr SW
- 236 Gordon St SW
- 361/552 NW Tenth Ave
- 298 Nelson Coffin Dr
- 226 N Main St
- 0 William Avera Rd
- 411 E Lee St
- 0 Benevolence Hwy Unit 26314983
Your Personal Tour Guide
Ask me questions while you tour the home.