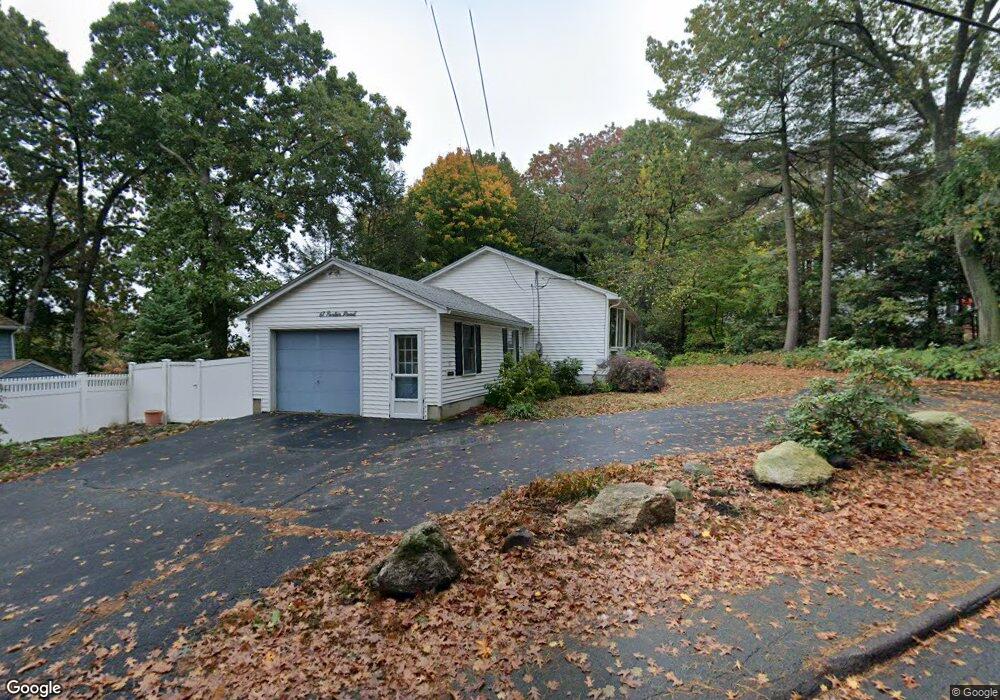
67 Parker Rd Wakefield, MA 01880
West Side NeighborhoodEstimated Value: $782,000 - $1,123,000
3
Beds
2
Baths
1,456
Sq Ft
$604/Sq Ft
Est. Value
About This Home
This home is located at 67 Parker Rd, Wakefield, MA 01880 and is currently estimated at $879,315, approximately $603 per square foot. 67 Parker Rd is a home located in Middlesex County with nearby schools including Wakefield Memorial High School and St Joseph School.
Ownership History
Date
Name
Owned For
Owner Type
Purchase Details
Closed on
Sep 24, 2008
Sold by
Wilkins Peter B
Bought by
Sabbag Daniel and Sabbag Eric D
Current Estimated Value
Purchase Details
Closed on
Oct 29, 2004
Sold by
67 Parker Road Nt and Poges Joseph F
Bought by
Wilkins M Lesley and Wilkins Peter B
Purchase Details
Closed on
Sep 14, 1990
Sold by
Mulvey Joseph J
Bought by
Gadbois Charles E
Create a Home Valuation Report for This Property
The Home Valuation Report is an in-depth analysis detailing your home's value as well as a comparison with similar homes in the area
Home Values in the Area
Average Home Value in this Area
Purchase History
| Date | Buyer | Sale Price | Title Company |
|---|---|---|---|
| Sabbag Daniel | $367,000 | -- | |
| Wilkins M Lesley | $415,167 | -- | |
| Gadbois Charles E | $52,500 | -- | |
| Gadbois Charles E | $52,500 | -- |
Source: Public Records
Mortgage History
| Date | Status | Borrower | Loan Amount |
|---|---|---|---|
| Open | Gadbois Charles E | $368,674 | |
| Closed | Gadbois Charles E | $368,674 | |
| Closed | Gadbois Charles E | $369,582 |
Source: Public Records
Tax History
| Year | Tax Paid | Tax Assessment Tax Assessment Total Assessment is a certain percentage of the fair market value that is determined by local assessors to be the total taxable value of land and additions on the property. | Land | Improvement |
|---|---|---|---|---|
| 2025 | $7,969 | $702,100 | $392,000 | $310,100 |
| 2024 | $7,666 | $681,400 | $380,400 | $301,000 |
| 2023 | $7,400 | $630,900 | $352,200 | $278,700 |
| 2022 | $7,067 | $573,600 | $320,200 | $253,400 |
| 2021 | $6,828 | $536,400 | $297,800 | $238,600 |
| 2020 | $6,566 | $514,200 | $285,500 | $228,700 |
| 2019 | $6,370 | $496,500 | $275,700 | $220,800 |
| 2018 | $6,028 | $465,500 | $258,400 | $207,100 |
| 2017 | $5,778 | $443,400 | $246,100 | $197,300 |
| 2016 | $5,710 | $423,300 | $227,700 | $195,600 |
| 2015 | $5,334 | $395,700 | $212,800 | $182,900 |
| 2014 | $4,900 | $383,400 | $206,200 | $177,200 |
Source: Public Records
Map
Nearby Homes
- 95 Prospect St
- 80 Redfield Rd
- 4 Adams St
- 2 Summit Dr Unit 43
- 1 Summit Dr Unit 57
- 311 Gazebo Cir Unit 311
- 403 Gazebo Cir
- 1014 Gazebo Cir Unit 1014
- 248 Albion St Unit 231
- 248 Albion St Unit 321
- 50 Quannapowitt Pkwy
- 252 Albion St Unit 3
- 241 Main St Unit C3
- 64 Main St Unit 24B
- 55 Bartley St
- 12 Isola Ln
- 66 Main St Unit 15A
- 62 Foundry St Unit 204
- 62 Foundry St Unit 402
- 62 Foundry St Unit 414
Your Personal Tour Guide
Ask me questions while you tour the home.