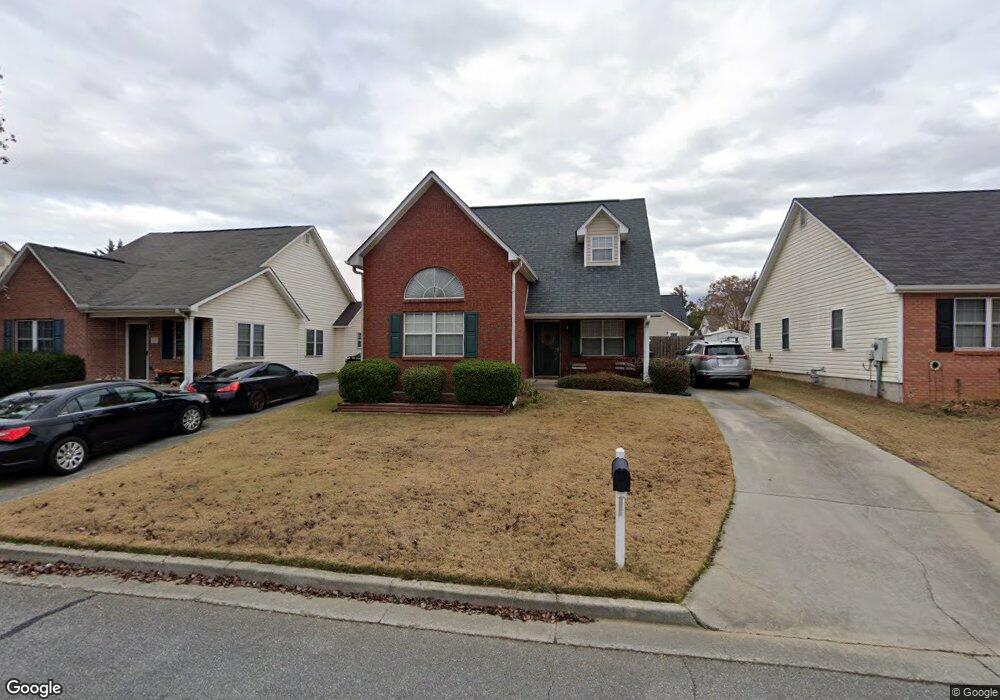
67 Pointe North Dr Cartersville, GA 30120
Estimated Value: $270,184 - $281,000
3
Beds
3
Baths
1,481
Sq Ft
$188/Sq Ft
Est. Value
About This Home
This home is located at 67 Pointe North Dr, Cartersville, GA 30120 and is currently estimated at $278,296, approximately $187 per square foot. 67 Pointe North Dr is a home located in Bartow County with nearby schools including Winegard Elementary School, Dommerich Elementary School, and Cartersville Elementary School.
Ownership History
Date
Name
Owned For
Owner Type
Purchase Details
Closed on
Aug 9, 2024
Sold by
Hicks Lindsey Whittenburg
Bought by
Terry Trampus Dylan
Current Estimated Value
Home Financials for this Owner
Home Financials are based on the most recent Mortgage that was taken out on this home.
Original Mortgage
$290,185
Outstanding Balance
$286,914
Interest Rate
6.89%
Mortgage Type
New Conventional
Estimated Equity
-$8,618
Purchase Details
Closed on
Apr 23, 2021
Sold by
Jackson Nicole Wilburn
Bought by
Whittenburg Lindsey
Home Financials for this Owner
Home Financials are based on the most recent Mortgage that was taken out on this home.
Original Mortgage
$204,040
Interest Rate
3.1%
Mortgage Type
New Conventional
Purchase Details
Closed on
Oct 25, 2006
Sold by
Wilburn Jackson Nicole
Bought by
Wilburn Jackson Nicole
Home Financials for this Owner
Home Financials are based on the most recent Mortgage that was taken out on this home.
Original Mortgage
$102,400
Interest Rate
6.27%
Mortgage Type
New Conventional
Create a Home Valuation Report for This Property
The Home Valuation Report is an in-depth analysis detailing your home's value as well as a comparison with similar homes in the area
Home Values in the Area
Average Home Value in this Area
Purchase History
| Date | Buyer | Sale Price | Title Company |
|---|---|---|---|
| Terry Trampus Dylan | $285,000 | -- | |
| Whittenburg Lindsey | $202,000 | -- | |
| Wilburn Jackson Nicole | -- | -- |
Source: Public Records
Mortgage History
| Date | Status | Borrower | Loan Amount |
|---|---|---|---|
| Open | Terry Trampus Dylan | $290,185 | |
| Previous Owner | Whittenburg Lindsey | $204,040 | |
| Previous Owner | Wilburn Jackson Nicole | $102,400 |
Source: Public Records
Tax History Compared to Growth
Tax History
| Year | Tax Paid | Tax Assessment Tax Assessment Total Assessment is a certain percentage of the fair market value that is determined by local assessors to be the total taxable value of land and additions on the property. | Land | Improvement |
|---|---|---|---|---|
| 2024 | $2,733 | $109,027 | $19,160 | $89,867 |
| 2023 | $2,733 | $104,661 | $19,160 | $85,501 |
| 2022 | $1,951 | $73,801 | $16,800 | $57,001 |
| 2021 | $1,546 | $60,439 | $16,800 | $43,639 |
| 2020 | $1,656 | $60,439 | $16,800 | $43,639 |
| 2019 | $1,493 | $53,280 | $16,800 | $36,480 |
| 2018 | $1,403 | $49,823 | $14,000 | $35,823 |
| 2017 | $1,295 | $45,159 | $10,000 | $35,159 |
| 2016 | $1,217 | $41,840 | $9,200 | $32,640 |
| 2015 | $1,189 | $41,840 | $9,200 | $32,640 |
| 2014 | $933 | $32,520 | $4,000 | $28,520 |
| 2013 | -- | $29,640 | $6,000 | $23,640 |
Source: Public Records
Map
Nearby Homes
- 23 Felton Walk Blvd
- 22 Felton Walk SE
- 16 Greenbriar Ave
- 160 Verona Dr NW
- 9 Greenbriar Ave
- 58 Quail Run
- 123 W Felton Rd
- 13 Shadow Ln
- 202 Mountain Chase
- 103 Ellicott Way
- 105 Ellicott Way
- 107 Ellicot Way
- 109 Ellicott Way
- 244 Grand Central Way
- 14 Harmony Cir
- 115 Davis Dr
- 16 Harmony Cir
- 12 Harmony Cir
- 10 Harmony Cir
- 67 Pointe Dr N
- 65 Pointe North Dr
- 69 Pointe North Dr
- 63 Pointe North Dr
- 71 Pointe North Dr
- 0 Pointe Way Unit 8532031
- 0 Pointe Way
- 20 Pointe Way Unit 106
- 20 Pointe Way Unit 108
- 20 Pointe Way
- 71 Pointe Dr N
- 24 Pointe Way
- 40 Pointe Way
- 61 Pointe North Dr
- 75 Pointe Dr N
- 75 Pointe North Dr
- 68 Pointe North Dr
- 16 Pointe Way
- 26 Pointe Way
- 70 Pointe North Dr