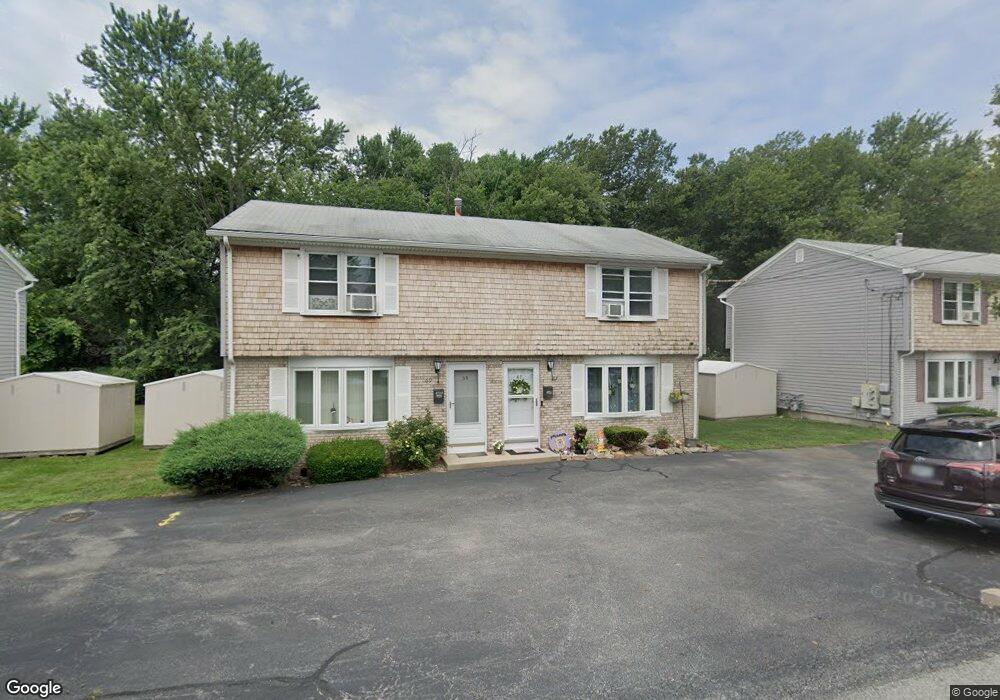
67 Reed St Unit 8 Warwick, RI 02886
Natick NeighborhoodEstimated Value: $281,000 - $297,638
2
Beds
2
Baths
1,030
Sq Ft
$280/Sq Ft
Est. Value
About This Home
This home is located at 67 Reed St Unit 8, Warwick, RI 02886 and is currently estimated at $288,910, approximately $280 per square foot. 67 Reed St Unit 8 is a home located in Kent County with nearby schools including Nel/Cps Construction Career, Islamic School of Rhode Island, and St Joseph School.
Ownership History
Date
Name
Owned For
Owner Type
Purchase Details
Closed on
Feb 4, 2022
Sold by
Garcia Alan
Bought by
Gaikwad Trushal
Current Estimated Value
Home Financials for this Owner
Home Financials are based on the most recent Mortgage that was taken out on this home.
Original Mortgage
$199,500
Outstanding Balance
$183,223
Interest Rate
3.45%
Mortgage Type
Purchase Money Mortgage
Estimated Equity
$105,687
Purchase Details
Closed on
Sep 4, 2020
Sold by
Sargent Laura A
Bought by
Garcia Alan
Purchase Details
Closed on
Mar 28, 2011
Sold by
Fnma
Bought by
Sargent Laura A W
Purchase Details
Closed on
Oct 7, 2010
Sold by
Bruner William H and Fnma
Bought by
Federal National Mortgage Association
Purchase Details
Closed on
Sep 22, 2005
Sold by
Howland Assoc Inc
Bought by
Bruner William H
Home Financials for this Owner
Home Financials are based on the most recent Mortgage that was taken out on this home.
Original Mortgage
$142,000
Interest Rate
5.92%
Mortgage Type
Purchase Money Mortgage
Create a Home Valuation Report for This Property
The Home Valuation Report is an in-depth analysis detailing your home's value as well as a comparison with similar homes in the area
Home Values in the Area
Average Home Value in this Area
Purchase History
We collect this data history from publicly available records. To have your information removed, we recommend requesting removal directly through your county’s website.
| Date | Buyer | Sale Price | Title Company |
|---|---|---|---|
| Gaikwad Trushal | $210,000 | None Available | |
| Garcia Alan | $90,000 | None Available | |
| Sargent Laura A W | $60,000 | -- | |
| Federal National Mortgage Association | $153,447 | -- | |
| Bruner William H | $177,500 | -- |
Source: Public Records
Mortgage History
We collect this data history from publicly available records. To have your information removed, we recommend requesting removal directly through your county’s website.
| Date | Status | Borrower | Loan Amount |
|---|---|---|---|
| Open | Gaikwad Trushal | $199,500 | |
| Previous Owner | Bruner William H | $185,000 | |
| Previous Owner | Bruner William H | $142,000 | |
| Previous Owner | Bruner William H | $35,500 |
Source: Public Records
Tax History
| Year | Tax Paid | Tax Assessment Tax Assessment Total Assessment is a certain percentage of the fair market value that is determined by local assessors to be the total taxable value of land and additions on the property. | Land | Improvement |
|---|---|---|---|---|
| 2025 | $3,213 | $253,000 | $0 | $253,000 |
| 2024 | $2,845 | $196,600 | $0 | $196,600 |
| 2023 | $2,790 | $196,600 | $0 | $196,600 |
| 2022 | $2,538 | $135,500 | $0 | $135,500 |
| 2021 | $2,538 | $135,500 | $0 | $135,500 |
| 2020 | $2,538 | $135,500 | $0 | $135,500 |
| 2019 | $2,538 | $135,500 | $0 | $135,500 |
| 2018 | $2,201 | $105,800 | $0 | $105,800 |
| 2017 | $2,141 | $105,800 | $0 | $105,800 |
| 2016 | $2,141 | $105,800 | $0 | $105,800 |
| 2015 | $2,231 | $107,500 | $0 | $107,500 |
| 2014 | $2,156 | $107,500 | $0 | $107,500 |
| 2013 | $2,127 | $107,500 | $0 | $107,500 |
Source: Public Records
Map
Nearby Homes
- 14 W Natick Rd
- 325 East St
- 101 Bateman Ave
- 309 East St
- 200 Mayfield Ave Unit C8
- 112 James St
- 104 James St
- 115 Edman St
- 123 Edman St
- 61 Rose Hill Dr
- 10 Fyffe Ave
- 32 Sunny View Ct
- 81 Cadora Ave
- 83 Cadora Ave
- 10 East St Unit 316
- 117 Haverhill Ave
- 17 Gloucester St
- 38 River St
- 56 River St Unit 31
- 833 Halifax Dr
- 51 Reed St
- 51 Reed St Unit 51
- 51 Reed St Unit 12
- 53 Reed St
- 53 Reed St Unit 11
- 59 Reed St
- 59 Reed St Unit 59
- 59 Reed St Unit 10
- 43 Reed St
- 43 Reed St Unit 43
- 43 Reed St Unit 18
- 43 Reed St Unit 14
- 61 Reed St
- 61 Reed St Unit 9
- 61 Reed St Unit 61
- 54 Reed St
- 67 Reed St
- 67 Reed St Unit 67
- 46 Reed St
- 33 Reed St
Your Personal Tour Guide
Ask me questions while you tour the home.