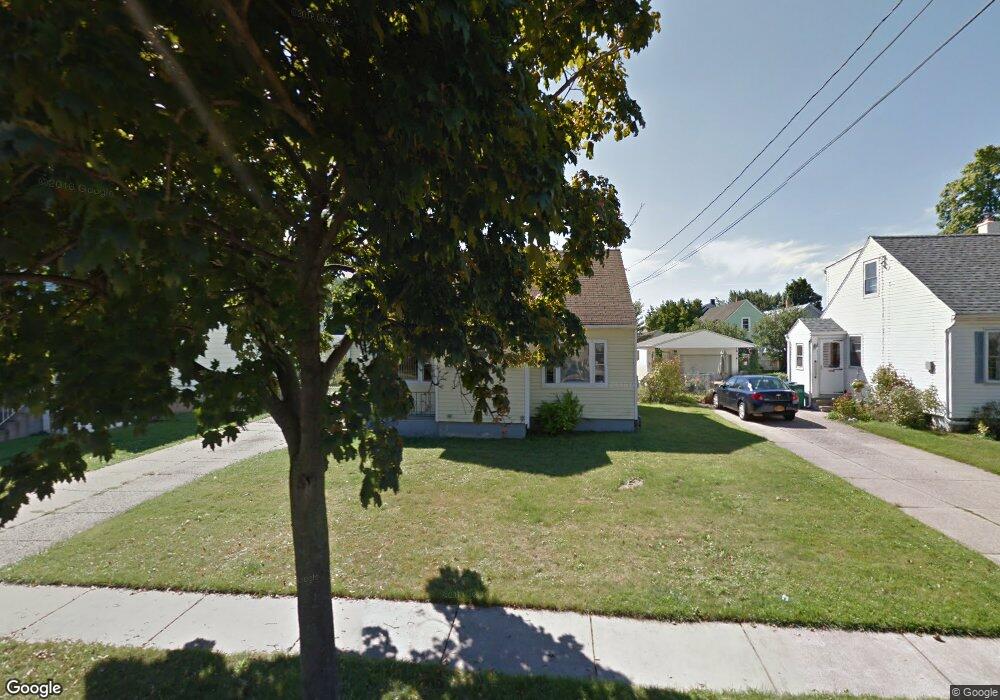
67 Regent St Buffalo, NY 14206
Lovejoy NeighborhoodEstimated Value: $134,000 - $184,512
3
Beds
2
Baths
1,229
Sq Ft
$134/Sq Ft
Est. Value
About This Home
This home is located at 67 Regent St, Buffalo, NY 14206 and is currently estimated at $164,878, approximately $134 per square foot. 67 Regent St is a home located in Erie County with nearby schools including Buffalo Academy of Science Charter School II and Darul Uloom Al Madania.
Ownership History
Date
Name
Owned For
Owner Type
Purchase Details
Closed on
Apr 11, 2024
Sold by
Mcmasters David M
Bought by
Zoizack James E and Zoizack Patricia
Current Estimated Value
Purchase Details
Closed on
Dec 9, 2011
Sold by
Mcmasters David M
Bought by
Zoizack James E and Zoizack Patricia A
Purchase Details
Closed on
Nov 16, 2006
Sold by
Lasek Scott M and Lasek Stacy Vanessa
Bought by
Mcmasters David M
Home Financials for this Owner
Home Financials are based on the most recent Mortgage that was taken out on this home.
Original Mortgage
$50,900
Interest Rate
6.33%
Mortgage Type
Purchase Money Mortgage
Purchase Details
Closed on
Jun 4, 1997
Sold by
Misiak Matthew J and Misiak Helen R
Bought by
Lasek Moulton Scott M Stacy
Create a Home Valuation Report for This Property
The Home Valuation Report is an in-depth analysis detailing your home's value as well as a comparison with similar homes in the area
Home Values in the Area
Average Home Value in this Area
Purchase History
| Date | Buyer | Sale Price | Title Company |
|---|---|---|---|
| Zoizack James E | -- | None Available | |
| Zoizack James E | -- | None Available | |
| Zoizack James E | -- | None Available | |
| Zoizack James E | -- | None Available | |
| Mcmasters David M | $52,500 | None Available | |
| Mcmasters David M | $52,500 | None Available | |
| Lasek Moulton Scott M Stacy | $50,000 | -- | |
| Lasek Moulton Scott M Stacy | $50,000 | -- |
Source: Public Records
Mortgage History
| Date | Status | Borrower | Loan Amount |
|---|---|---|---|
| Previous Owner | Mcmasters David M | $50,900 |
Source: Public Records
Tax History Compared to Growth
Tax History
| Year | Tax Paid | Tax Assessment Tax Assessment Total Assessment is a certain percentage of the fair market value that is determined by local assessors to be the total taxable value of land and additions on the property. | Land | Improvement |
|---|---|---|---|---|
| 2024 | $461 | $91,000 | $5,800 | $85,200 |
| 2023 | $461 | $91,000 | $5,800 | $85,200 |
| 2022 | $458 | $91,000 | $5,800 | $85,200 |
| 2021 | $458 | $91,000 | $5,800 | $85,200 |
| 2020 | $423 | $91,000 | $5,800 | $85,200 |
| 2019 | $1,509 | $55,000 | $5,500 | $49,500 |
| 2018 | $1,420 | $55,000 | $5,500 | $49,500 |
| 2017 | $327 | $55,000 | $5,500 | $49,500 |
| 2016 | $1,339 | $55,000 | $5,500 | $49,500 |
| 2015 | -- | $55,000 | $5,500 | $49,500 |
| 2014 | -- | $55,000 | $5,500 | $49,500 |
Source: Public Records
Map
Nearby Homes
- 81 Moreland St
- 105 Regent St
- 35 Moreland St
- 107 Stanley St
- 16 Regent St
- 109 Stanley St
- 46 Bogardus St
- 1068 E Lovejoy St
- 1061 E Lovejoy St
- 1083 E Lovejoy St
- 115 Greene St
- 1112 E Lovejoy St
- 214 Benzinger St
- 324 Ideal St
- 74 Vanderbilt St
- 160 Benzinger St
- 43 Ludington St
- 199 Benzinger St
- 30 Reiman St
- 67 Greene St