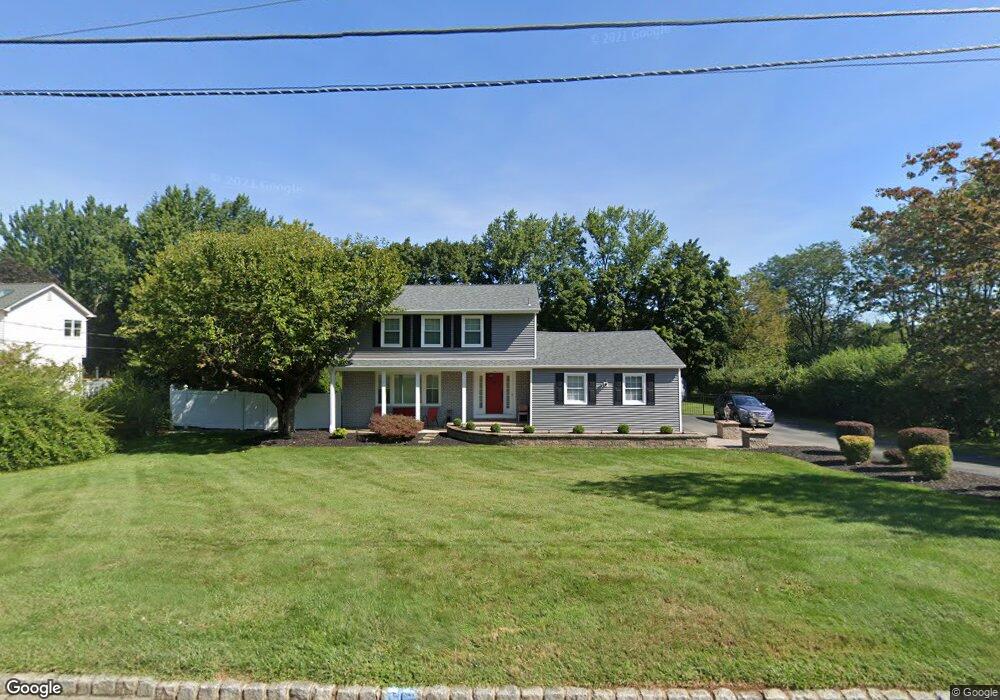
67 Ridge Rd Randolph, NJ 07869
Estimated Value: $681,719 - $796,000
--
Bed
--
Bath
1,952
Sq Ft
$378/Sq Ft
Est. Value
About This Home
This home is located at 67 Ridge Rd, Randolph, NJ 07869 and is currently estimated at $737,180, approximately $377 per square foot. 67 Ridge Rd is a home located in Morris County with nearby schools including Randolph High School, Randolph Middle School, and Gottesman RTW Academy.
Ownership History
Date
Name
Owned For
Owner Type
Purchase Details
Closed on
Jun 27, 2008
Sold by
Conca Frank A and Conca Carmella
Bought by
Mancuso Frank and Mancuso Karen
Current Estimated Value
Home Financials for this Owner
Home Financials are based on the most recent Mortgage that was taken out on this home.
Original Mortgage
$210,000
Outstanding Balance
$46,965
Interest Rate
6.01%
Mortgage Type
Purchase Money Mortgage
Estimated Equity
$690,215
Purchase Details
Closed on
May 22, 2004
Sold by
George Larue
Bought by
Conca Frank and Conca Carmella
Create a Home Valuation Report for This Property
The Home Valuation Report is an in-depth analysis detailing your home's value as well as a comparison with similar homes in the area
Home Values in the Area
Average Home Value in this Area
Purchase History
| Date | Buyer | Sale Price | Title Company |
|---|---|---|---|
| Mancuso Frank | $562,500 | Chicago Title Insurance Co | |
| Conca Frank | $230,000 | -- |
Source: Public Records
Mortgage History
| Date | Status | Borrower | Loan Amount |
|---|---|---|---|
| Open | Mancuso Frank | $210,000 |
Source: Public Records
Tax History Compared to Growth
Tax History
| Year | Tax Paid | Tax Assessment Tax Assessment Total Assessment is a certain percentage of the fair market value that is determined by local assessors to be the total taxable value of land and additions on the property. | Land | Improvement |
|---|---|---|---|---|
| 2025 | $11,641 | $411,200 | $161,200 | $250,000 |
| 2024 | $11,349 | $411,200 | $161,200 | $250,000 |
| 2023 | $11,349 | $411,200 | $161,200 | $250,000 |
| 2022 | $10,905 | $411,200 | $161,200 | $250,000 |
| 2021 | $10,905 | $411,200 | $161,200 | $250,000 |
| 2020 | $10,794 | $411,200 | $161,200 | $250,000 |
| 2019 | $10,671 | $411,200 | $161,200 | $250,000 |
| 2018 | $10,535 | $411,200 | $161,200 | $250,000 |
| 2017 | $10,403 | $411,200 | $161,200 | $250,000 |
| 2016 | $10,127 | $276,700 | $116,200 | $160,500 |
| 2015 | $10,005 | $276,700 | $116,200 | $160,500 |
| 2014 | $9,851 | $276,700 | $116,200 | $160,500 |
Source: Public Records
Map
Nearby Homes
- 93 Hilltop Dr
- 23 Dogwood Trail
- 1 Dogwood Trail
- 32 Highview Terrace
- 400 Quaker Church Rd
- 137 Hurd St
- 50 Oakwood Ave
- 121 Hurd St
- 181 Randolph Ave
- 400 -37 E Randolph Ave Unit 37
- 193 Randolph Ave
- 42 5th Ave
- 12 Xenia Ct
- 9 Alan Ln
- 00 5th Ave
- 223 W Randolph Ave
- 0 U S 46
- 1 Rockridge Terrace
- 108 Dover Chester Rd
- 62 U S 46