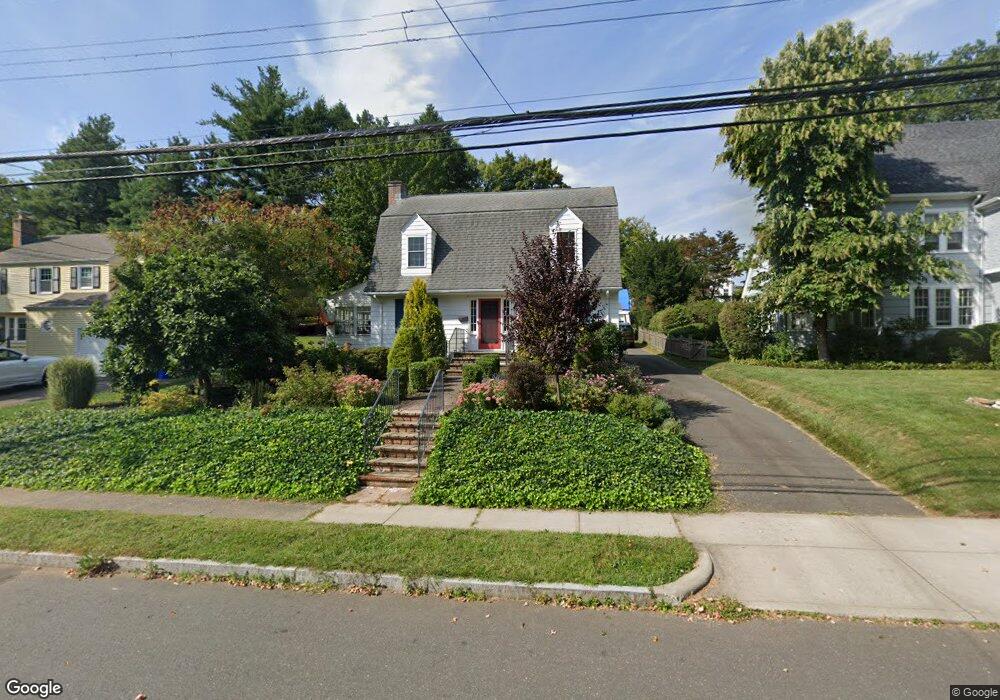
67 Riggs Ave West Hartford, CT 06107
Estimated Value: $590,000 - $674,000
3
Beds
2
Baths
1,692
Sq Ft
$365/Sq Ft
Est. Value
About This Home
This home is located at 67 Riggs Ave, West Hartford, CT 06107 and is currently estimated at $617,565, approximately $364 per square foot. 67 Riggs Ave is a home located in Hartford County with nearby schools including Duffy School, Sedgwick Middle School, and Conard High School.
Ownership History
Date
Name
Owned For
Owner Type
Purchase Details
Closed on
Jun 28, 2021
Sold by
Udal Matthew
Bought by
Udal Matthew D and Udal Betsy A
Current Estimated Value
Home Financials for this Owner
Home Financials are based on the most recent Mortgage that was taken out on this home.
Original Mortgage
$308,000
Outstanding Balance
$279,462
Interest Rate
2.9%
Mortgage Type
Stand Alone Refi Refinance Of Original Loan
Estimated Equity
$338,103
Purchase Details
Closed on
Oct 4, 2010
Sold by
Udal Betsy A
Bought by
Udal Matthew
Purchase Details
Closed on
Jan 11, 2010
Sold by
Goecks Robert L and Goecks Linda A
Bought by
Udal Matthew and Udal Betsy A
Home Financials for this Owner
Home Financials are based on the most recent Mortgage that was taken out on this home.
Original Mortgage
$320,585
Interest Rate
4.78%
Purchase Details
Closed on
Mar 23, 1989
Sold by
Johnson Dary Lee
Bought by
Garde Ronald T
Create a Home Valuation Report for This Property
The Home Valuation Report is an in-depth analysis detailing your home's value as well as a comparison with similar homes in the area
Home Values in the Area
Average Home Value in this Area
Purchase History
| Date | Buyer | Sale Price | Title Company |
|---|---|---|---|
| Udal Matthew D | -- | None Available | |
| Udal Matthew D | -- | None Available | |
| Udal Matthew | -- | -- | |
| Udal Matthew | $326,500 | -- | |
| Udal Matthew | -- | -- | |
| Udal Matthew | $326,500 | -- | |
| Garde Ronald T | $190,000 | -- |
Source: Public Records
Mortgage History
| Date | Status | Borrower | Loan Amount |
|---|---|---|---|
| Open | Udal Matthew D | $308,000 | |
| Previous Owner | Garde Ronald T | $320,585 |
Source: Public Records
Tax History Compared to Growth
Tax History
| Year | Tax Paid | Tax Assessment Tax Assessment Total Assessment is a certain percentage of the fair market value that is determined by local assessors to be the total taxable value of land and additions on the property. | Land | Improvement |
|---|---|---|---|---|
| 2025 | $13,532 | $302,190 | $155,610 | $146,580 |
| 2024 | $12,884 | $304,220 | $155,610 | $148,610 |
| 2023 | $12,449 | $304,220 | $155,610 | $148,610 |
| 2022 | $12,376 | $304,220 | $155,610 | $148,610 |
| 2021 | $11,889 | $280,280 | $161,560 | $118,720 |
| 2020 | $11,057 | $264,530 | $151,270 | $113,260 |
| 2019 | $11,057 | $264,530 | $151,270 | $113,260 |
| 2018 | $10,846 | $264,530 | $151,270 | $113,260 |
| 2017 | $10,675 | $260,120 | $151,270 | $108,850 |
| 2016 | $9,403 | $238,000 | $108,220 | $129,780 |
| 2015 | $9,118 | $238,000 | $108,220 | $129,780 |
| 2014 | $8,894 | $238,000 | $108,220 | $129,780 |
Source: Public Records
Map
Nearby Homes
- 51 Lemay St
- 1925 Boulevard
- 632 Park Rd
- 1640 Boulevard
- 2 Arapahoe Rd Unit 308
- 2 Arapahoe Rd Unit 415
- 2 Arapahoe Rd Unit 611
- 2 Arapahoe Rd Unit 613
- 2 Arapahoe Rd Unit 311
- 2 Arapahoe Rd Unit 312
- 2 Arapahoe Rd Unit 510
- 2 Arapahoe Rd Unit 610
- 2 Arapahoe Rd Unit 609
- 2 Arapahoe Rd Unit 606
- 2 Arapahoe Rd Unit 505
- 2 Arapahoe Rd Unit 605
- 2 Arapahoe Rd Unit 313
- 2 Arapahoe Rd Unit 604
- 2 Arapahoe Rd Unit 607
- 2 Arapahoe Rd Unit 603