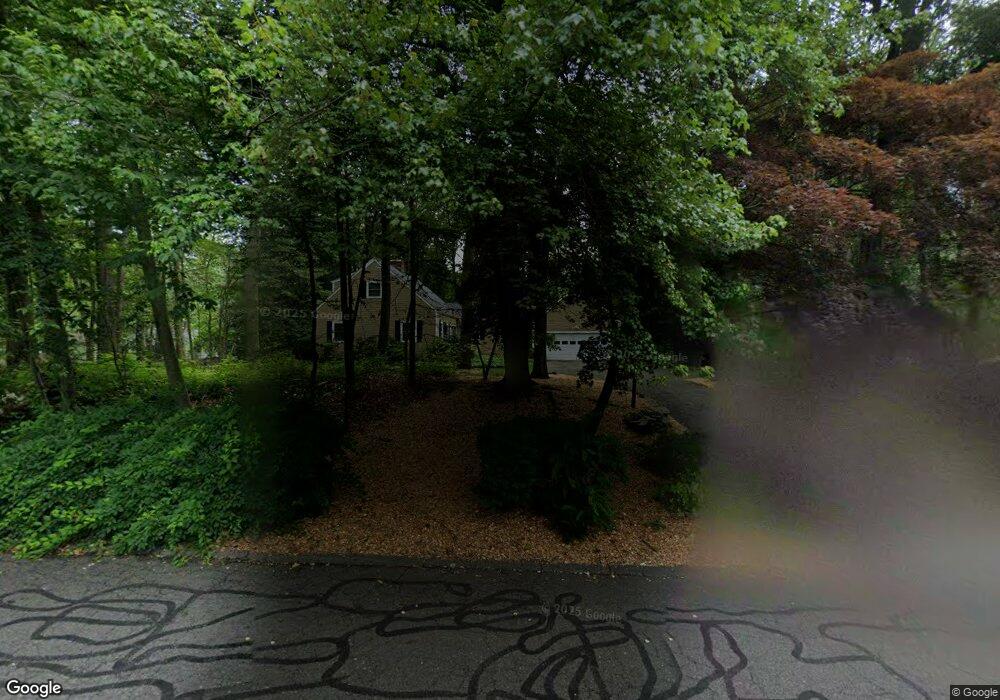
67 Rolling Ridge Rd Stamford, CT 06903
North Stamford NeighborhoodEstimated Value: $924,000 - $1,009,000
3
Beds
3
Baths
2,382
Sq Ft
$406/Sq Ft
Est. Value
About This Home
This home is located at 67 Rolling Ridge Rd, Stamford, CT 06903 and is currently estimated at $966,340, approximately $405 per square foot. 67 Rolling Ridge Rd is a home located in Fairfield County with nearby schools including Northeast Elementary School, Turn of River School, and Westhill High School.
Ownership History
Date
Name
Owned For
Owner Type
Purchase Details
Closed on
Feb 22, 2024
Sold by
Cox Ellen
Bought by
Levin Michael
Current Estimated Value
Purchase Details
Closed on
Feb 2, 2024
Sold by
Ellen Cox T and Ellen Cox
Bought by
Cox Ellen
Purchase Details
Closed on
Jan 20, 2011
Sold by
Cox Ellen
Bought by
Cox Ellen
Create a Home Valuation Report for This Property
The Home Valuation Report is an in-depth analysis detailing your home's value as well as a comparison with similar homes in the area
Home Values in the Area
Average Home Value in this Area
Purchase History
| Date | Buyer | Sale Price | Title Company |
|---|---|---|---|
| Levin Michael | $759,000 | None Available | |
| Cox Ellen | -- | None Available | |
| Cox Ellen | -- | -- |
Source: Public Records
Mortgage History
| Date | Status | Borrower | Loan Amount |
|---|---|---|---|
| Previous Owner | Cox Ellen | $85,600 | |
| Previous Owner | Cox Ellen | $90,000 |
Source: Public Records
Tax History Compared to Growth
Tax History
| Year | Tax Paid | Tax Assessment Tax Assessment Total Assessment is a certain percentage of the fair market value that is determined by local assessors to be the total taxable value of land and additions on the property. | Land | Improvement |
|---|---|---|---|---|
| 2025 | $12,026 | $516,790 | $255,450 | $261,340 |
| 2024 | $11,762 | $516,790 | $255,450 | $261,340 |
| 2023 | $12,641 | $516,790 | $255,450 | $261,340 |
| 2022 | $10,756 | $408,500 | $193,520 | $214,980 |
| 2021 | $10,609 | $408,500 | $193,520 | $214,980 |
| 2020 | $10,347 | $408,500 | $193,520 | $214,980 |
| 2019 | $10,347 | $408,500 | $193,520 | $214,980 |
| 2018 | $9,988 | $408,500 | $193,520 | $214,980 |
| 2017 | $10,070 | $393,530 | $201,940 | $191,590 |
| 2016 | $9,767 | $393,530 | $201,940 | $191,590 |
| 2015 | $9,500 | $393,530 | $201,940 | $191,590 |
| 2014 | $9,173 | $393,530 | $201,940 | $191,590 |
Source: Public Records
Map
Nearby Homes
- 115 Mayapple Rd
- 65 Mcintosh Rd
- 2993 High Ridge Rd
- 78 Trinity Pass
- 61 Shady Ln
- 22 Blackberry Dr E
- 32 Joshua Hobby Ln
- 22 Joshua Hobby Ln
- 1287 Rock Rimmon Rd
- 23 Kendall Rd
- 199 Upper Shad Rd
- 49 Alexandra Dr
- 226 Ingleside Dr
- 52 Mill Spring Ln
- 30 Dulan Dr
- 518 Woodbine Rd
- 2856 Long Ridge Rd
- 501 Woodbine Rd
- 0 Rolling Meadow Ln Unit ONEH6302491
- 43 Mill Rd
- 51 Rolling Ridge Rd
- 93 Rolling Ridge Rd
- 74 Coventry Rd
- 66 Rolling Ridge Rd
- 46 Rolling Ridge Rd
- 52 Coventry Rd
- 72 Rolling Ridge Rd
- 0 Coventry Ln
- 35 Rolling Ridge Rd
- 84 Rolling Ridge Rd
- 92 Rolling Ridge Rd
- 40 Rolling Ridge Rd
- 77 Coventry Rd
- 91 Coventry Rd
- 36 Coventry Rd
- 105 Coventry Rd
- 59 Coventry Rd
- 21 Rolling Ridge Rd
- 31 Boulderol Rd