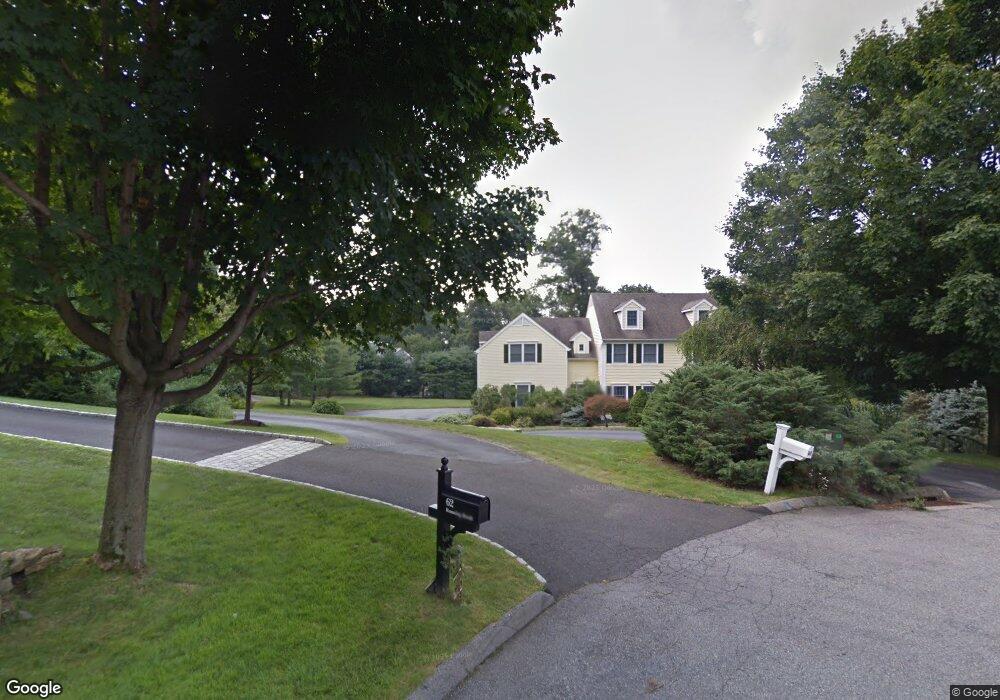
67 Runningbrook Ln New Canaan, CT 06840
Estimated Value: $2,348,456 - $3,007,000
6
Beds
5
Baths
4,445
Sq Ft
$603/Sq Ft
Est. Value
About This Home
This home is located at 67 Runningbrook Ln, New Canaan, CT 06840 and is currently estimated at $2,681,614, approximately $603 per square foot. 67 Runningbrook Ln is a home located in Fairfield County with nearby schools including West Elementary School, Saxe Middle School, and New Canaan High School.
Ownership History
Date
Name
Owned For
Owner Type
Purchase Details
Closed on
Jul 3, 2024
Sold by
Gershman Amanda B and Gershman Marcus B
Bought by
Gershman Frlt 7 3 2024 and Gershman
Current Estimated Value
Purchase Details
Closed on
Aug 5, 2019
Sold by
Berry Mark and Berry Lauren
Bought by
Gershman Marcus and Gershman Amanda
Home Financials for this Owner
Home Financials are based on the most recent Mortgage that was taken out on this home.
Original Mortgage
$1,180,000
Interest Rate
3.73%
Mortgage Type
Purchase Money Mortgage
Purchase Details
Closed on
Jun 28, 2002
Sold by
Santoni John and Santoni Pamela
Bought by
Berry Mark E and Berry Lauren E
Purchase Details
Closed on
Oct 27, 1995
Sold by
Ruck Thomas G and Ruck Dolores M
Bought by
Santoni John and Santoni Pamela
Purchase Details
Closed on
Jan 28, 1994
Sold by
James Fieber Tr
Bought by
Ruck Thomas and Ruck Dolores
Create a Home Valuation Report for This Property
The Home Valuation Report is an in-depth analysis detailing your home's value as well as a comparison with similar homes in the area
Home Values in the Area
Average Home Value in this Area
Purchase History
| Date | Buyer | Sale Price | Title Company |
|---|---|---|---|
| Gershman Frlt 7 3 2024 | -- | None Available | |
| Gershman Frlt 7 3 2024 | -- | None Available | |
| Gershman Marcus | $1,475,000 | -- | |
| Gershman Marcus | $1,475,000 | -- | |
| Berry Mark E | $1,860,000 | -- | |
| Santoni John | $856,650 | -- | |
| Berry Mark E | $1,860,000 | -- | |
| Santoni John | $856,650 | -- | |
| Ruck Thomas | $920,000 | -- |
Source: Public Records
Mortgage History
| Date | Status | Borrower | Loan Amount |
|---|---|---|---|
| Previous Owner | Gershman Marcus | $1,180,000 | |
| Previous Owner | Ruck Thomas | $708,750 | |
| Previous Owner | Ruck Thomas | $950,000 |
Source: Public Records
Tax History Compared to Growth
Tax History
| Year | Tax Paid | Tax Assessment Tax Assessment Total Assessment is a certain percentage of the fair market value that is determined by local assessors to be the total taxable value of land and additions on the property. | Land | Improvement |
|---|---|---|---|---|
| 2025 | $23,650 | $1,417,010 | $494,900 | $922,110 |
| 2024 | $22,871 | $1,417,010 | $494,900 | $922,110 |
| 2023 | $19,741 | $1,042,300 | $474,600 | $567,700 |
| 2022 | $19,147 | $1,042,300 | $474,600 | $567,700 |
| 2021 | $18,928 | $1,042,300 | $474,600 | $567,700 |
| 2020 | $18,928 | $1,042,300 | $474,600 | $567,700 |
| 2019 | $19,012 | $1,042,300 | $474,600 | $567,700 |
| 2018 | $20,847 | $1,229,200 | $502,250 | $726,950 |
| 2017 | $20,491 | $1,229,200 | $502,250 | $726,950 |
| 2016 | $20,048 | $1,229,200 | $502,250 | $726,950 |
| 2015 | $20,356 | $1,229,200 | $502,250 | $726,950 |
| 2014 | $19,102 | $1,229,200 | $502,250 | $726,950 |
Source: Public Records
Map
Nearby Homes
- 39 Running Brook Ln
- 1552 Hope St
- 119 Wedgemere Rd
- 357 Jelliff Mill Rd
- 113 Skyview Ln
- 77 Putter Dr
- 139 Jelliff Mill Rd
- 19 Woodway Rd Unit 14
- 474 Ponus Ridge
- 358 Hoyt St
- 185 Interlaken Rd
- 17 Oenoke Place
- 23 Oenoke Place
- 95 Columbus Place Unit 6
- 44 Scofield Farms
- 1157 Hope St
- 1148 Hope St
- 16 Columbus Place
- 865 Hollow Tree Ridge Rd
- 32 Kensett Ln Unit 32
- 67 Running Brook Ln
- 57 Friars Ln
- 68 Running Brook Ln
- 68 Runningbrook Ln
- 57 Running Brook Ln
- 57 Runningbrook Ln
- 62 Runningbrook Ln
- 62 Running Brook Ln
- 59 Running Brook Ln
- 59 Runningbrook Ln
- 55 Runningbrook Ln
- 55 Running Brook Ln
- 53 Broad Brook Ln
- 50 Friars Ln
- 51 Broad Brook Ln
- 44 Running Brook Ln
- 44 Runningbrook Ln
- 42 Friars Ln
- 26 Ponus Ridge
- 111 Ward Ln