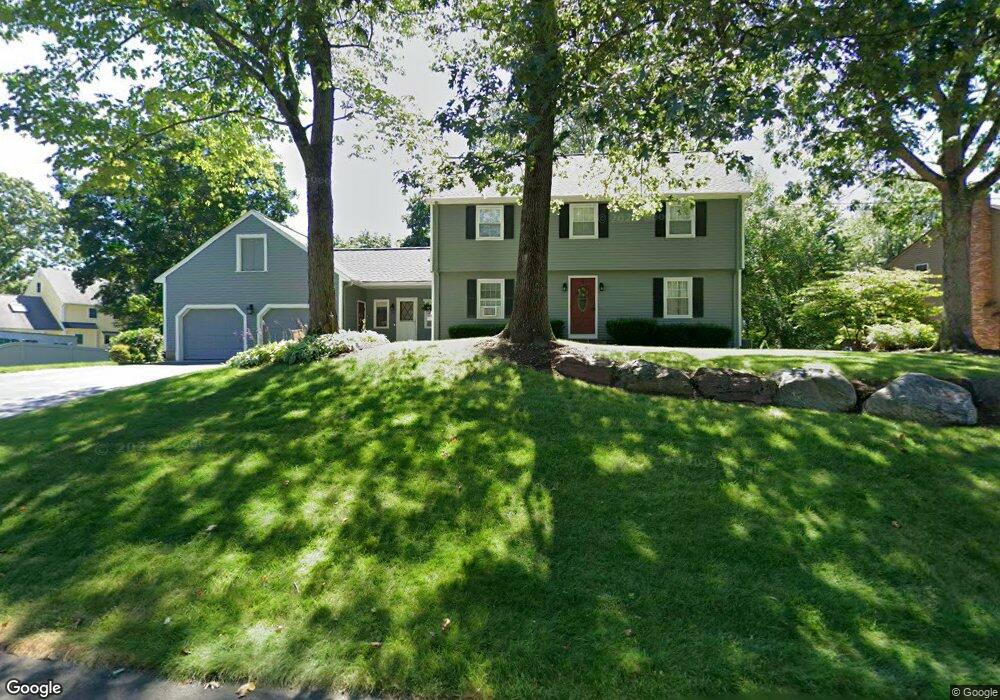
67 Ryder Cir North Attleboro, MA 02760
North Attleboro NeighborhoodEstimated Value: $671,000 - $819,000
4
Beds
3
Baths
2,252
Sq Ft
$330/Sq Ft
Est. Value
About This Home
This home is located at 67 Ryder Cir, North Attleboro, MA 02760 and is currently estimated at $743,389, approximately $330 per square foot. 67 Ryder Cir is a home located in Bristol County with nearby schools including North Attleboro High School and Cadence Academy Preschool - North Attleborough.
Ownership History
Date
Name
Owned For
Owner Type
Purchase Details
Closed on
Jan 30, 1992
Sold by
Robertson Wm R and Robertson Linda M
Bought by
Goss Richard G and Goss Julie E
Current Estimated Value
Home Financials for this Owner
Home Financials are based on the most recent Mortgage that was taken out on this home.
Original Mortgage
$138,500
Interest Rate
8.44%
Mortgage Type
Purchase Money Mortgage
Create a Home Valuation Report for This Property
The Home Valuation Report is an in-depth analysis detailing your home's value as well as a comparison with similar homes in the area
Home Values in the Area
Average Home Value in this Area
Purchase History
| Date | Buyer | Sale Price | Title Company |
|---|---|---|---|
| Goss Richard G | $183,500 | -- |
Source: Public Records
Mortgage History
| Date | Status | Borrower | Loan Amount |
|---|---|---|---|
| Open | Goss Richard G | $127,700 | |
| Closed | Goss Richard G | $138,500 |
Source: Public Records
Tax History Compared to Growth
Tax History
| Year | Tax Paid | Tax Assessment Tax Assessment Total Assessment is a certain percentage of the fair market value that is determined by local assessors to be the total taxable value of land and additions on the property. | Land | Improvement |
|---|---|---|---|---|
| 2025 | $7,280 | $617,500 | $153,200 | $464,300 |
| 2024 | $7,253 | $628,500 | $153,200 | $475,300 |
| 2023 | $6,757 | $528,300 | $153,200 | $375,100 |
| 2022 | $6,399 | $459,400 | $153,200 | $306,200 |
| 2021 | $5,931 | $415,600 | $153,200 | $262,400 |
| 2020 | $5,856 | $408,100 | $153,200 | $254,900 |
| 2019 | $5,312 | $373,000 | $139,300 | $233,700 |
| 2018 | $4,796 | $359,500 | $139,300 | $220,200 |
| 2017 | $4,753 | $359,500 | $139,300 | $220,200 |
| 2016 | $4,659 | $352,400 | $154,800 | $197,600 |
| 2015 | $4,481 | $341,000 | $154,800 | $186,200 |
| 2014 | $4,283 | $323,500 | $135,800 | $187,700 |
Source: Public Records
Map
Nearby Homes
- 34 Hawthorne St
- 64 Smith St
- 35-R Whiting St
- 2 Franklin Ave
- 271 N Washington St
- 194 Smith St
- 835 Mt Hope St Unit 39
- 157 Fisher St
- 45 Moran St
- 39 Columbia St
- 633 E Washington St Unit 17
- 12 Houde St
- 0 Landry 2nd Unit 73350867
- 105 East St
- 68 N Washington St Unit 210
- 711 Mount Hope St Unit 13
- 711 Mount Hope St Unit 8
- 711 Mount Hope St Unit 11
- 711 Mount Hope St Unit 12
- 711 Mount Hope St Unit 15