Estimated Value: $160,000 - $209,000
3
Beds
1
Bath
967
Sq Ft
$187/Sq Ft
Est. Value
About This Home
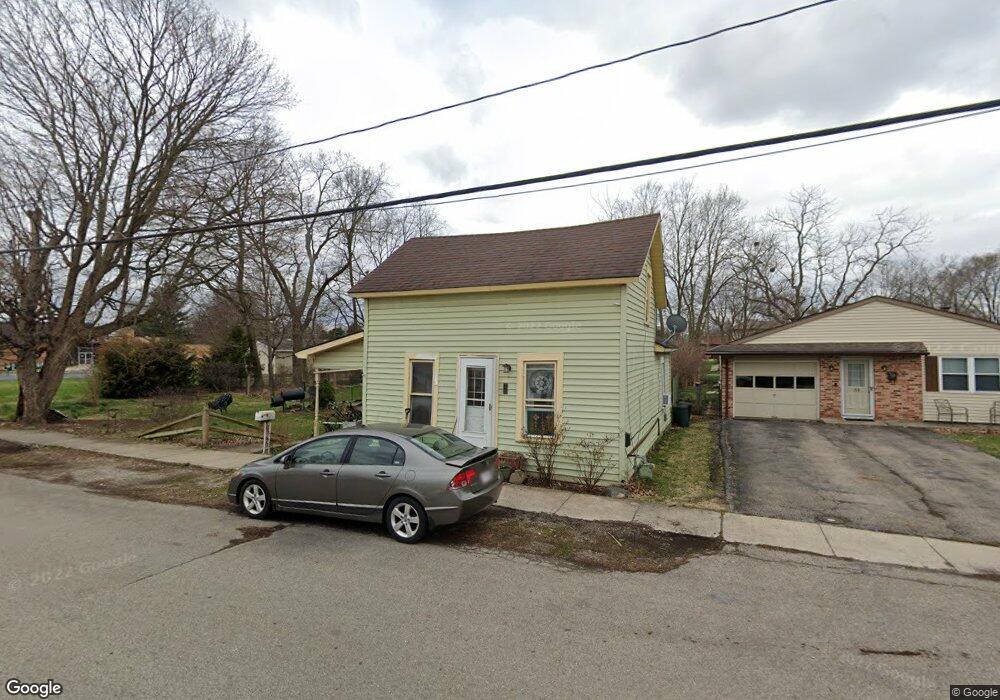
This home is located at 67 S Harrison St, Enon, OH 45323 and is currently estimated at $180,667, approximately $186 per square foot. 67 S Harrison St is a home located in Clark County with nearby schools including Greenon Elementary School, Greenon Jr. High School, and Greenon High School.
Ownership History
Date
Name
Owned For
Owner Type
Purchase Details
Closed on
Jun 2, 2008
Sold by
Linice Grove Llc
Bought by
Fries Scott V and Fries Marilyn K
Current Estimated Value
Purchase Details
Closed on
Oct 15, 2003
Sold by
Shaw Daniel E and Shaw Nancy L
Bought by
Linice Grove Llc
Purchase Details
Closed on
Oct 19, 2001
Sold by
Linice Grove Llc
Bought by
Shaw Daniel E and Shaw Nancy L
Home Financials for this Owner
Home Financials are based on the most recent Mortgage that was taken out on this home.
Original Mortgage
$58,900
Interest Rate
8%
Mortgage Type
Purchase Money Mortgage
Purchase Details
Closed on
Sep 21, 2001
Sold by
Frock Raymond E and Frock Martha M
Bought by
Fries Scott V and Fries Marilyn K
Home Financials for this Owner
Home Financials are based on the most recent Mortgage that was taken out on this home.
Original Mortgage
$58,900
Interest Rate
8%
Mortgage Type
Purchase Money Mortgage
Create a Home Valuation Report for This Property
The Home Valuation Report is an in-depth analysis detailing your home's value as well as a comparison with similar homes in the area
Home Values in the Area
Average Home Value in this Area
Purchase History
| Date | Buyer | Sale Price | Title Company |
|---|---|---|---|
| Fries Scott V | -- | Attorney | |
| Linice Grove Llc | -- | -- | |
| Shaw Daniel E | $67,000 | -- | |
| Linice Grove Llc | -- | -- | |
| Fries Scott V | $62,000 | -- |
Source: Public Records
Mortgage History
| Date | Status | Borrower | Loan Amount |
|---|---|---|---|
| Previous Owner | Fries Scott V | $58,900 | |
| Closed | Shaw Daniel E | $0 |
Source: Public Records
Tax History
| Year | Tax Paid | Tax Assessment Tax Assessment Total Assessment is a certain percentage of the fair market value that is determined by local assessors to be the total taxable value of land and additions on the property. | Land | Improvement |
|---|---|---|---|---|
| 2025 | $1,585 | $32,780 | $9,380 | $23,400 |
| 2024 | $1,592 | $27,120 | $8,960 | $18,160 |
| 2023 | $1,592 | $27,120 | $8,960 | $18,160 |
| 2022 | $1,590 | $27,120 | $8,960 | $18,160 |
| 2021 | $1,474 | $22,170 | $7,280 | $14,890 |
| 2020 | $1,477 | $22,170 | $7,280 | $14,890 |
| 2019 | $1,451 | $21,500 | $7,280 | $14,220 |
| 2018 | $1,320 | $18,980 | $7,280 | $11,700 |
| 2017 | $1,323 | $18,981 | $7,284 | $11,697 |
| 2016 | $1,141 | $18,981 | $7,284 | $11,697 |
| 2015 | $1,146 | $18,505 | $7,284 | $11,221 |
| 2014 | $1,148 | $18,505 | $7,284 | $11,221 |
| 2013 | $1,056 | $18,505 | $7,284 | $11,221 |
Source: Public Records
Map
Nearby Homes
- 303 E Main St
- 100 Green Valley Dr
- 141 N Xenia Dr
- 3924 Schenley St
- 4024 Raymond Dr
- 4200 Phillips St
- 4538 Cynthia Dr
- 144 Matthews Ave
- 2151 Willow Run Cir Unit 2151
- 2133 Willow Run Cir Unit 2133
- 2072 Willow Run Cir
- 7050 Creekside Cir
- 1010 Meadow Lark Dr
- 4600 Snider Rd
- 5463 Enon-Xenia Rd
- 2925 S Tecumseh Rd
- 7850 Kings Ridge Cir
- 0 Enon-Xenia Rd
- 6 Danzig Ln
- 6250 Fairfield Pike
- 55 S Harrison St
- 43 S Harrison St
- 70 S Harrison St
- 120 Broadway Rd
- 31 S Harrison St
- 94 S Pleasant St
- 84 S Pleasant St
- 25 S Harrison St
- 78 S Harrison St Unit A
- 58 S Harrison St
- 21 S Harrison St
- 76 S Pleasant St
- 82 S Harrison St Unit C
- 82 S Harrison St Unit A
- 32 S Harrison St
- 60 S Pleasant St
- 30 S Harrison St
- 19 S Harrison St
- 40 S Pleasant St
- 22 S Harrison St
Your Personal Tour Guide
Ask me questions while you tour the home.