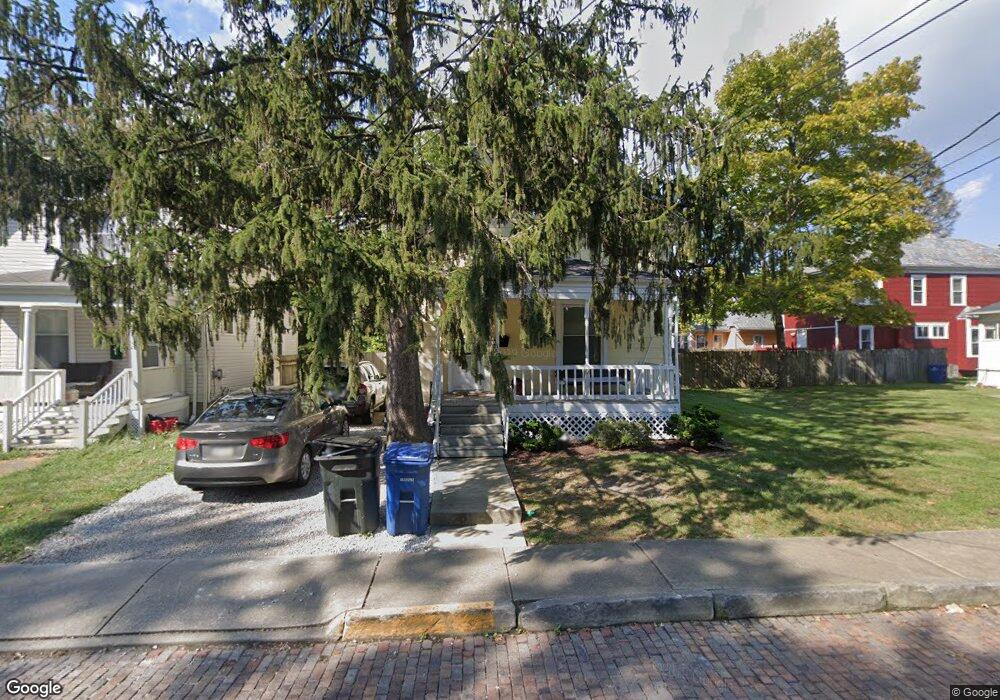
67 S Knox St Westerville, OH 43081
Estimated Value: $304,000 - $330,000
3
Beds
2
Baths
1,348
Sq Ft
$238/Sq Ft
Est. Value
About This Home
This home is located at 67 S Knox St, Westerville, OH 43081 and is currently estimated at $320,617, approximately $237 per square foot. 67 S Knox St is a home located in Franklin County with nearby schools including Whittier Elementary School, Blendon Middle School, and Westerville South High School.
Ownership History
Date
Name
Owned For
Owner Type
Purchase Details
Closed on
Oct 5, 2009
Sold by
Bronner John H
Bought by
67 S Knox Street Llc
Current Estimated Value
Home Financials for this Owner
Home Financials are based on the most recent Mortgage that was taken out on this home.
Original Mortgage
$120,000
Outstanding Balance
$78,797
Interest Rate
5.19%
Mortgage Type
Future Advance Clause Open End Mortgage
Estimated Equity
$241,820
Purchase Details
Closed on
May 29, 2008
Sold by
Deutsche Bank National Trust Co
Bought by
Bronner John H
Purchase Details
Closed on
Apr 7, 2008
Sold by
Lindsey Karia A and Case #07Cve04 4816
Bought by
Deutsche Bank National Trust Co and Argent Mortgage Loan Trust 2005-W1 Asset
Purchase Details
Closed on
Sep 17, 2002
Sold by
Lindsey Karla A and The Lacovone Family Trust
Bought by
Lindsey Karla A
Purchase Details
Closed on
Jul 7, 2000
Sold by
Iacovone Teresa F
Bought by
Iacovone Teresa F and Lindsey Karla A
Purchase Details
Closed on
Dec 22, 1977
Bought by
Iacovone Teresa F
Create a Home Valuation Report for This Property
The Home Valuation Report is an in-depth analysis detailing your home's value as well as a comparison with similar homes in the area
Home Values in the Area
Average Home Value in this Area
Purchase History
| Date | Buyer | Sale Price | Title Company |
|---|---|---|---|
| 67 S Knox Street Llc | -- | All Ohio T | |
| Bronner John H | $127,900 | Resource T | |
| Deutsche Bank National Trust Co | $115,000 | Allodial | |
| Lindsey Karla A | -- | -- | |
| Iacovone Teresa F | -- | -- | |
| Iacovone Teresa F | -- | -- |
Source: Public Records
Mortgage History
| Date | Status | Borrower | Loan Amount |
|---|---|---|---|
| Open | 67 S Knox Street Llc | $120,000 |
Source: Public Records
Tax History Compared to Growth
Tax History
| Year | Tax Paid | Tax Assessment Tax Assessment Total Assessment is a certain percentage of the fair market value that is determined by local assessors to be the total taxable value of land and additions on the property. | Land | Improvement |
|---|---|---|---|---|
| 2024 | $4,975 | $85,510 | $20,720 | $64,790 |
| 2023 | $4,872 | $85,505 | $20,720 | $64,785 |
| 2022 | $4,754 | $63,710 | $12,220 | $51,490 |
| 2021 | $4,794 | $63,710 | $12,220 | $51,490 |
| 2020 | $4,781 | $63,710 | $12,220 | $51,490 |
| 2019 | $4,057 | $50,930 | $12,220 | $38,710 |
| 2018 | $3,692 | $50,930 | $12,220 | $38,710 |
| 2017 | $3,752 | $50,930 | $12,220 | $38,710 |
| 2016 | $3,510 | $40,740 | $11,410 | $29,330 |
| 2015 | $3,403 | $40,740 | $11,410 | $29,330 |
| 2014 | $3,405 | $40,740 | $11,410 | $29,330 |
| 2013 | $1,618 | $38,780 | $10,850 | $27,930 |
Source: Public Records
Map
Nearby Homes
- 79 W Park St
- 53 W College Ave
- 92 N Vine St
- 160 N State St
- 175 N State St
- 199 E College Ave
- 247 Foxtrail Place
- 502 Foxtrail Cir E Unit 502
- 385 Hockberry Ave Unit Lot 1603
- 325 Vannette Ln Unit Lot 602
- 466 S State St
- 470 S State St
- 317 Vannette Ln Unit Lot 604
- 476 S State St
- 319 Vannette Ln Unit Lot 603
- Highwood Plan at Towns on the Greenway
- Halston with Loft Plan at Towns on the Greenway
- Halston Plan at Towns on the Greenway
- Highwood with Loft Plan at Towns on the Greenway
- 327 Vannette Ln Unit Lot 601