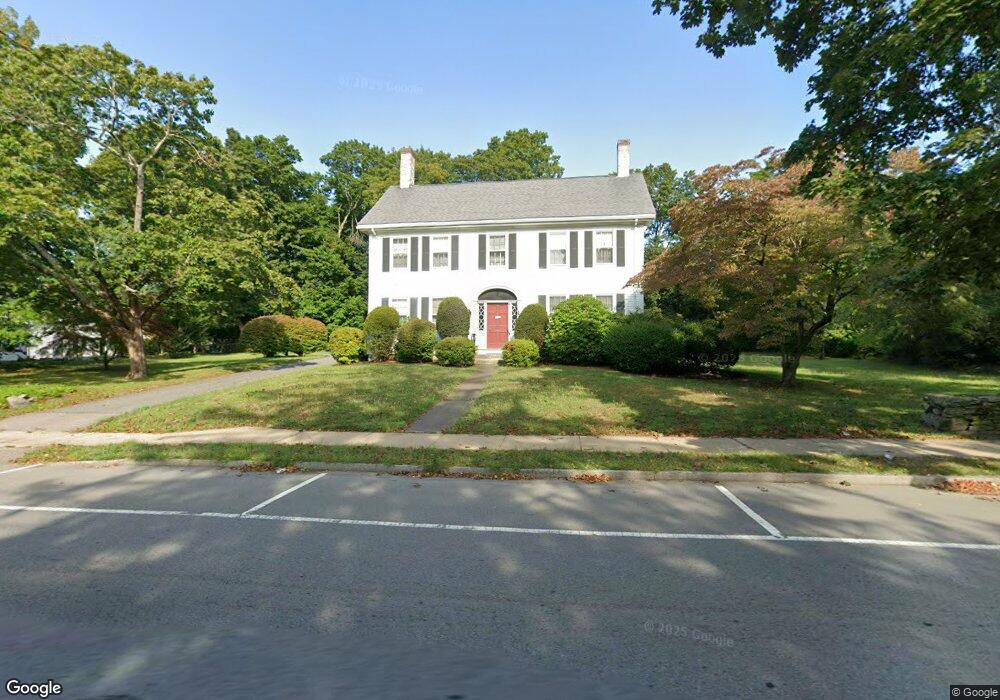
67 S Main St Middleboro, MA 02346
Estimated Value: $618,000 - $738,838
4
Beds
3
Baths
3,923
Sq Ft
$171/Sq Ft
Est. Value
About This Home
This home is located at 67 S Main St, Middleboro, MA 02346 and is currently estimated at $669,210, approximately $170 per square foot. 67 S Main St is a home located in Plymouth County with nearby schools including Mary K. Goode Elementary School and Mullein Hill Christian Academy.
Ownership History
Date
Name
Owned For
Owner Type
Purchase Details
Closed on
Sep 15, 1995
Sold by
Eaton William S and Eaton Mary W
Bought by
Hilton James C and Hilton Marion K
Current Estimated Value
Create a Home Valuation Report for This Property
The Home Valuation Report is an in-depth analysis detailing your home's value as well as a comparison with similar homes in the area
Home Values in the Area
Average Home Value in this Area
Purchase History
| Date | Buyer | Sale Price | Title Company |
|---|---|---|---|
| Hilton James C | $188,000 | -- |
Source: Public Records
Mortgage History
| Date | Status | Borrower | Loan Amount |
|---|---|---|---|
| Open | Hilton James C | $235,000 | |
| Closed | Hilton James C | $42,000 |
Source: Public Records
Tax History Compared to Growth
Tax History
| Year | Tax Paid | Tax Assessment Tax Assessment Total Assessment is a certain percentage of the fair market value that is determined by local assessors to be the total taxable value of land and additions on the property. | Land | Improvement |
|---|---|---|---|---|
| 2025 | $8,126 | $606,000 | $173,900 | $432,100 |
| 2024 | $8,001 | $590,900 | $165,700 | $425,200 |
| 2023 | $7,288 | $511,800 | $165,700 | $346,100 |
| 2022 | $6,772 | $440,300 | $144,000 | $296,300 |
| 2021 | $6,820 | $419,200 | $126,300 | $292,900 |
| 2020 | $6,369 | $401,100 | $126,300 | $274,800 |
| 2019 | $6,209 | $401,100 | $126,300 | $274,800 |
| 2018 | $5,502 | $352,700 | $120,300 | $232,400 |
| 2017 | $5,308 | $336,600 | $115,900 | $220,700 |
| 2016 | $4,881 | $306,600 | $106,000 | $200,600 |
| 2015 | $4,671 | $296,000 | $105,400 | $190,600 |
Source: Public Records
Map
Nearby Homes