W
Seller's Agent in 2019
Wendy Jordan
Walzel Properties - Corporate Office
(832) 813-8078
1 Total Sale

Estimated Value: $745,000 - $866,000
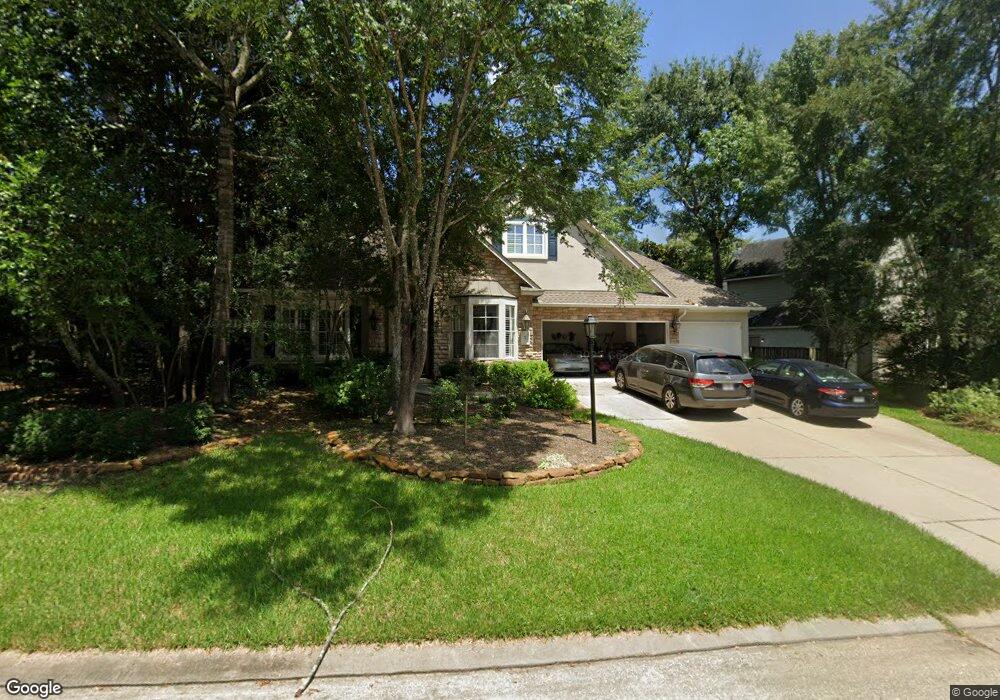
Fabulous, recently UPDATED Lifeforms home you won't recognize as a Lifeforms plan! Extremely WELL MAINTAINED home in wonderful family neighborhood of Alden Bridge Plum Crest. Featuring new wood-looking tile throughout 1st level. Open concept kitchen & den w/ corner (floor to ceiling stone) fireplace & high ceilings overlooking beautiful pool & spa w/ rock waterfall. Large Open Kitchen features stainless appliances- Gas stove, double ovens w/ warming drawer, dishwasher & replaced cabinets w/ extra storage. 3" Wood shutters front & back. 3 Bedrooms Down including Master. Master bath features free standing tub & frameless shower, new countertops, cabinets & lighting. Large utility room w/ extra storage. 3 car garage w/ extra storage in garage. Walk in climate controlled storage galore & oversized closet upstairs. All bathrooms updated. Gameroom up complete with surround sound. Recently replaced downstairs AC, roof & skylight. Outdoor lighting in backyard.
Last Agent to Sell the Property
Walzel Properties - Corporate Office License #0477333 Listed on: 09/17/2019

| Date | Buyer | Sale Price | Title Company |
|---|---|---|---|
| Vance David | -- | Chicago Title | |
| Harris Darrin T | -- | Charter Title Company | |
| Webster Bradley M | -- | American Title Co |
| Date | Status | Borrower | Loan Amount |
|---|---|---|---|
| Open | Vance David | $432,000 | |
| Previous Owner | Harris Darrin T | $63,500 | |
| Previous Owner | Harris Darrin T | $254,000 | |
| Previous Owner | Webster Bradley M | $237,000 |
| Date | Event | Price | List to Sale | Price per Sq Ft |
|---|---|---|---|---|
| 10/06/2024 10/06/24 | Off Market | -- | -- | -- |
| 11/04/2019 11/04/19 | Sold | -- | -- | -- |
| 10/05/2019 10/05/19 | Pending | -- | -- | -- |
| 09/17/2019 09/17/19 | For Sale | $550,000 | -- | $145 / Sq Ft |
| Year | Tax Paid | Tax Assessment Tax Assessment Total Assessment is a certain percentage of the fair market value that is determined by local assessors to be the total taxable value of land and additions on the property. | Land | Improvement |
|---|---|---|---|---|
| 2025 | $10,814 | $723,177 | $100,000 | $623,177 |
| 2024 | $9,814 | $695,750 | -- | -- |
| 2023 | $9,814 | $632,500 | $100,000 | $601,550 |
| 2022 | $11,655 | $575,000 | $100,000 | $475,000 |
| 2021 | $11,468 | $525,800 | $60,790 | $465,010 |
| 2020 | $12,091 | $522,710 | $60,790 | $461,920 |
| 2019 | $10,740 | $450,000 | $60,790 | $389,210 |
| 2018 | $9,115 | $422,900 | $60,790 | $362,110 |
| 2017 | $10,872 | $450,000 | $60,790 | $389,210 |
| 2016 | $11,215 | $464,190 | $60,790 | $403,400 |
| 2015 | $9,466 | $437,040 | $60,790 | $386,310 |
| 2014 | $9,466 | $397,310 | $60,790 | $372,350 |
W
Seller's Agent in 2019
Wendy Jordan
Walzel Properties - Corporate Office
(832) 813-8078
1 Total Sale
L
Buyer's Agent in 2019
Lacey Sparks
Weichert, Realtors - The Murray Group
(281) 374-8100
2 in this area
57 Total Sales
Source: Houston Association of REALTORS®
MLS Number: 64269791
APN: 9719-64-05100
Disclaimer: Certain information contained herein is derived from information provided by parties other than Homes.com. All information provided is deemed reliable, but is not guaranteed to be accurate and should be independently verified.
![]() Copyright 2026, Houston REALTORS® Information Service, Inc.
Copyright 2026, Houston REALTORS® Information Service, Inc.
The information provided is exclusively for consumers’ personal, non-commercial use, and may not be used for any purpose other than to identify prospective properties consumers may be interested in purchasing.
Information is deemed reliable but not guaranteed.
Ask me questions while you tour the home.