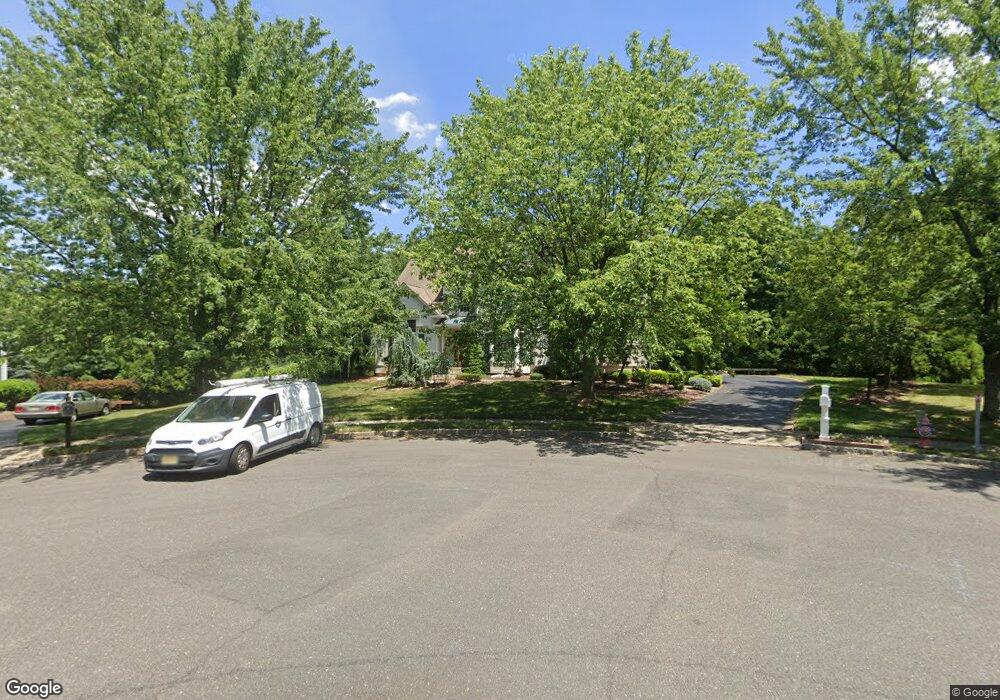
67 Sage St Holmdel, NJ 07733
Estimated Value: $1,508,000 - $1,861,000
4
Beds
3
Baths
4,225
Sq Ft
$411/Sq Ft
Est. Value
About This Home
This home is located at 67 Sage St, Holmdel, NJ 07733 and is currently estimated at $1,738,412, approximately $411 per square foot. 67 Sage St is a home located in Monmouth County with nearby schools including Village School, Indian Hill Elementary School, and William Satz Intermediate School.
Ownership History
Date
Name
Owned For
Owner Type
Purchase Details
Closed on
Jan 3, 2008
Sold by
Wang Yitong and Xue Jingjie
Bought by
Erakin Cagatay and Olcay Sezer
Current Estimated Value
Home Financials for this Owner
Home Financials are based on the most recent Mortgage that was taken out on this home.
Original Mortgage
$800,000
Outstanding Balance
$500,750
Interest Rate
6%
Mortgage Type
Purchase Money Mortgage
Estimated Equity
$1,237,662
Purchase Details
Closed on
Oct 21, 2002
Sold by
Pulte Home Corp
Bought by
Wang Yitong and Jingjie Xue
Home Financials for this Owner
Home Financials are based on the most recent Mortgage that was taken out on this home.
Original Mortgage
$500,000
Interest Rate
6.17%
Create a Home Valuation Report for This Property
The Home Valuation Report is an in-depth analysis detailing your home's value as well as a comparison with similar homes in the area
Home Values in the Area
Average Home Value in this Area
Purchase History
| Date | Buyer | Sale Price | Title Company |
|---|---|---|---|
| Erakin Cagatay | $1,200,000 | Fidelity Natl Title Ins Co | |
| Wang Yitong | $785,640 | -- |
Source: Public Records
Mortgage History
| Date | Status | Borrower | Loan Amount |
|---|---|---|---|
| Open | Erakin Cagatay | $800,000 | |
| Previous Owner | Wang Yitong | $500,000 |
Source: Public Records
Tax History Compared to Growth
Tax History
| Year | Tax Paid | Tax Assessment Tax Assessment Total Assessment is a certain percentage of the fair market value that is determined by local assessors to be the total taxable value of land and additions on the property. | Land | Improvement |
|---|---|---|---|---|
| 2025 | $23,000 | $1,513,300 | $659,000 | $854,300 |
| 2024 | $22,270 | $1,459,400 | $682,700 | $776,700 |
| 2023 | $22,270 | $1,368,800 | $637,900 | $730,900 |
| 2022 | $20,678 | $1,147,700 | $547,100 | $600,600 |
| 2021 | $20,678 | $1,030,800 | $449,000 | $581,800 |
| 2020 | $21,106 | $1,035,100 | $439,300 | $595,800 |
| 2019 | $20,842 | $1,027,200 | $412,100 | $615,100 |
| 2018 | $20,313 | $1,005,100 | $346,000 | $659,100 |
| 2017 | $20,109 | $991,100 | $304,600 | $686,500 |
| 2016 | $21,781 | $1,085,800 | $338,500 | $747,300 |
| 2015 | $21,325 | $1,066,800 | $399,600 | $667,200 |
| 2014 | $19,613 | $938,400 | $419,000 | $519,400 |
Source: Public Records
Map
Nearby Homes