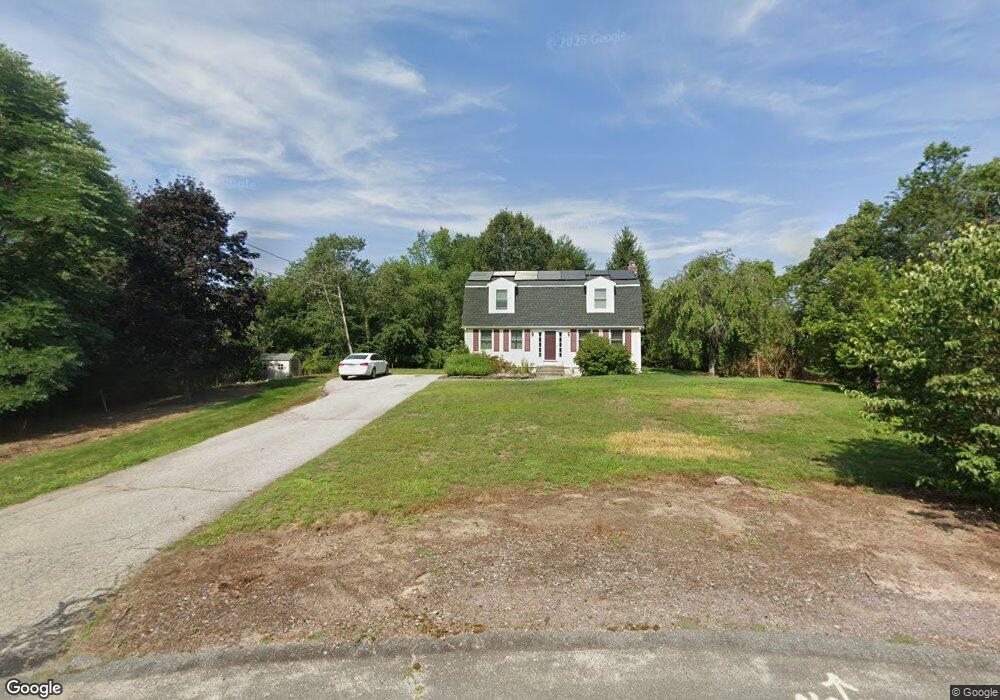
67 Samuel Way Attleboro, MA 02703
Estimated Value: $589,198 - $647,000
3
Beds
2
Baths
1,752
Sq Ft
$357/Sq Ft
Est. Value
About This Home
This home is located at 67 Samuel Way, Attleboro, MA 02703 and is currently estimated at $626,300, approximately $357 per square foot. 67 Samuel Way is a home located in Bristol County with nearby schools including Hill-Roberts Elementary School, Robert J. Coelho Middle School, and Attleboro High School.
Ownership History
Date
Name
Owned For
Owner Type
Purchase Details
Closed on
Oct 1, 2001
Sold by
Cronan Paul M and Cronan Lisa J
Bought by
Seifel Cheryl
Current Estimated Value
Home Financials for this Owner
Home Financials are based on the most recent Mortgage that was taken out on this home.
Original Mortgage
$236,550
Outstanding Balance
$92,729
Interest Rate
6.91%
Mortgage Type
Purchase Money Mortgage
Estimated Equity
$533,571
Purchase Details
Closed on
Jun 5, 1992
Sold by
Freitas Richard and Freitas Karen
Bought by
Cronan Paul M and Pelletier Lisa J
Home Financials for this Owner
Home Financials are based on the most recent Mortgage that was taken out on this home.
Original Mortgage
$121,950
Interest Rate
8.8%
Mortgage Type
Purchase Money Mortgage
Create a Home Valuation Report for This Property
The Home Valuation Report is an in-depth analysis detailing your home's value as well as a comparison with similar homes in the area
Home Values in the Area
Average Home Value in this Area
Purchase History
| Date | Buyer | Sale Price | Title Company |
|---|---|---|---|
| Seifel Cheryl | $249,000 | -- | |
| Cronan Paul M | $128,405 | -- |
Source: Public Records
Mortgage History
| Date | Status | Borrower | Loan Amount |
|---|---|---|---|
| Open | Cronan Paul M | $236,550 | |
| Previous Owner | Cronan Paul M | $115,000 | |
| Previous Owner | Cronan Paul M | $121,950 |
Source: Public Records
Tax History Compared to Growth
Tax History
| Year | Tax Paid | Tax Assessment Tax Assessment Total Assessment is a certain percentage of the fair market value that is determined by local assessors to be the total taxable value of land and additions on the property. | Land | Improvement |
|---|---|---|---|---|
| 2025 | $6,402 | $510,100 | $180,000 | $330,100 |
| 2024 | $6,091 | $478,500 | $162,600 | $315,900 |
| 2023 | $5,551 | $405,500 | $164,200 | $241,300 |
| 2022 | $5,453 | $377,400 | $156,800 | $220,600 |
| 2021 | $5,161 | $348,700 | $151,000 | $197,700 |
| 2020 | $5,017 | $344,600 | $144,400 | $200,200 |
| 2019 | $4,588 | $324,000 | $141,800 | $182,200 |
| 2018 | $4,751 | $320,600 | $137,800 | $182,800 |
| 2017 | $4,380 | $301,000 | $134,400 | $166,600 |
| 2016 | $4,268 | $288,000 | $126,100 | $161,900 |
| 2015 | $4,264 | $289,900 | $126,100 | $163,800 |
| 2014 | $4,072 | $274,200 | $120,600 | $153,600 |
Source: Public Records
Map
Nearby Homes
- 59 Samuel Way
- 130 Zoar Ave
- 101 Middle St
- 15 Arline Dr
- 517 Newport Ave
- 39 Slade Ave
- 0 Middle St
- 64 Highland Ave Unit A
- 64 Highland Ave Unit B
- 176 Read St
- 44 Buffington St
- 980 Newport Ave
- 295 Newport Ave
- 56 Liberty Dr
- 27 Killarney Way
- 135 Cumberland Ave
- 53 Liberty Dr
- 12 Tyson Place
- 31 Kevin Dr
- 48 Liberty Dr