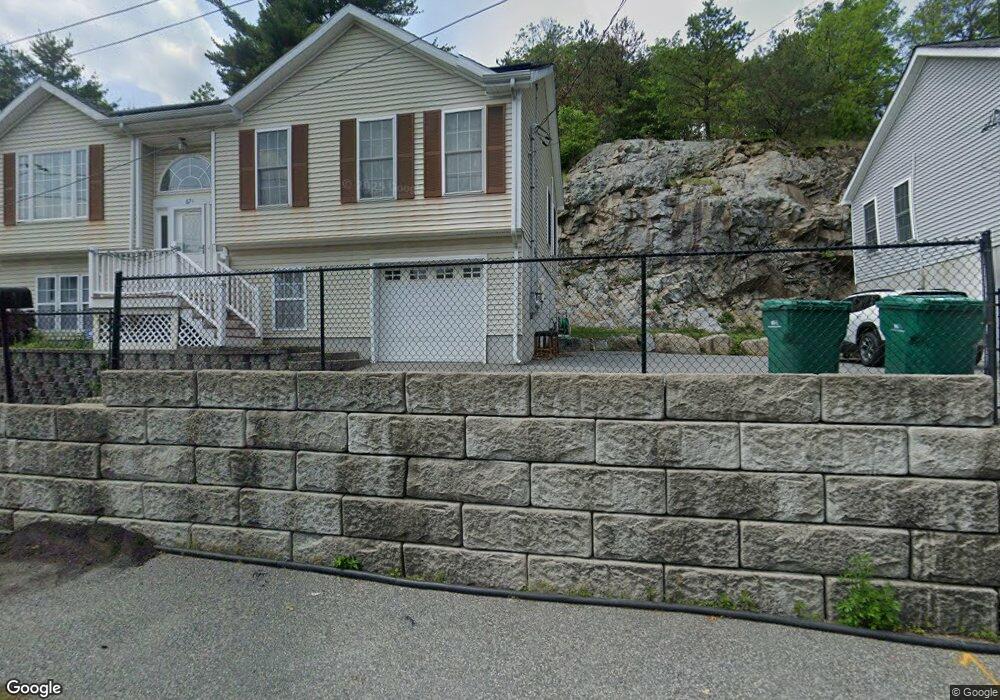
67 Saunders Rd Lynn, MA 01904
Indian Ridge NeighborhoodEstimated Value: $650,000 - $751,000
3
Beds
3
Baths
1,188
Sq Ft
$595/Sq Ft
Est. Value
About This Home
This home is located at 67 Saunders Rd, Lynn, MA 01904 and is currently estimated at $707,393, approximately $595 per square foot. 67 Saunders Rd is a home located in Essex County with nearby schools including Lynn Woods Elementary School, William R. Fallon School, and Pickering Middle School.
Ownership History
Date
Name
Owned For
Owner Type
Purchase Details
Closed on
Oct 8, 2009
Sold by
Browns Pond Rt and Vitali Samuel A
Bought by
Tshiabuila Justin and Mulumba Prudence
Current Estimated Value
Home Financials for this Owner
Home Financials are based on the most recent Mortgage that was taken out on this home.
Original Mortgage
$304,000
Interest Rate
5.14%
Mortgage Type
Purchase Money Mortgage
Purchase Details
Closed on
May 14, 2009
Sold by
Browns Pond Rt
Bought by
Day Daniel W
Purchase Details
Closed on
Mar 10, 2009
Sold by
Rogers Robert
Bought by
Vitali Samuel A
Create a Home Valuation Report for This Property
The Home Valuation Report is an in-depth analysis detailing your home's value as well as a comparison with similar homes in the area
Home Values in the Area
Average Home Value in this Area
Purchase History
| Date | Buyer | Sale Price | Title Company |
|---|---|---|---|
| Tshiabuila Justin | $315,000 | -- | |
| Vitali Tr Samuel A | -- | -- | |
| Day Daniel W | -- | -- | |
| Day Daniel W | $320,000 | -- | |
| Vitali Samuel A | -- | -- |
Source: Public Records
Mortgage History
| Date | Status | Borrower | Loan Amount |
|---|---|---|---|
| Open | Vitali Samuel A | $282,700 | |
| Closed | Vitali Samuel A | $304,000 |
Source: Public Records
Tax History
| Year | Tax Paid | Tax Assessment Tax Assessment Total Assessment is a certain percentage of the fair market value that is determined by local assessors to be the total taxable value of land and additions on the property. | Land | Improvement |
|---|---|---|---|---|
| 2025 | $6,901 | $666,100 | $203,700 | $462,400 |
| 2024 | $6,716 | $637,800 | $188,400 | $449,400 |
| 2023 | $6,441 | $577,700 | $182,000 | $395,700 |
| 2022 | $6,403 | $515,100 | $152,300 | $362,800 |
| 2021 | $6,228 | $478,000 | $149,700 | $328,300 |
| 2020 | $6,246 | $466,100 | $158,600 | $307,500 |
| 2019 | $6,119 | $427,900 | $137,400 | $290,500 |
| 2018 | $5,993 | $395,600 | $149,300 | $246,300 |
| 2017 | $5,510 | $353,200 | $128,500 | $224,700 |
| 2016 | $5,922 | $366,000 | $117,400 | $248,600 |
| 2015 | $5,306 | $316,800 | $117,400 | $199,400 |
Source: Public Records
Map
Nearby Homes
- 30 Longwood Rd
- 9 Sutcliffe Rd
- 30 Fair Oaks Ave
- 275 Lynnfield St Unit 275
- 175 Jenness St
- 333 Lynnfield St
- 10 Fairview Rd
- 103 Kernwood Dr
- 43 Gedney Dr
- 75 Park Rd
- 52 Savory St Unit 52
- 52 Savory St Unit A
- 42 Great Woods Rd
- 54 Harris Rd
- 2 Anchor Rd
- 217 Cedar Brook Rd
- 26 Bartholomew Terrace
- 277 Euclid Ave
- 9 Hermon Rd
- 11 Urban St
Your Personal Tour Guide
Ask me questions while you tour the home.