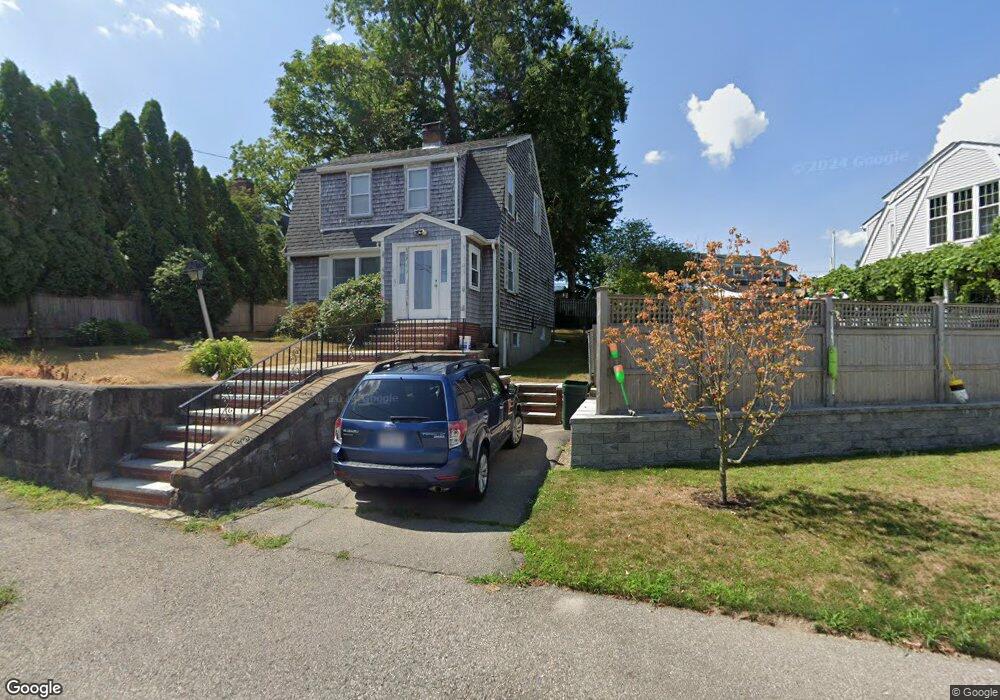
67 Shoreham St Quincy, MA 02171
Squantum NeighborhoodEstimated Value: $668,000 - $794,000
3
Beds
2
Baths
1,232
Sq Ft
$605/Sq Ft
Est. Value
About This Home
This home is located at 67 Shoreham St, Quincy, MA 02171 and is currently estimated at $744,968, approximately $604 per square foot. 67 Shoreham St is a home located in Norfolk County with nearby schools including Squantum Elementary School, Atlantic Middle School, and North Quincy High School.
Ownership History
Date
Name
Owned For
Owner Type
Purchase Details
Closed on
Mar 11, 2020
Sold by
Noenickx Claire M
Bought by
Claire M Noenickx Ret
Current Estimated Value
Purchase Details
Closed on
Aug 3, 1998
Sold by
Gillis Marlene F
Bought by
Noenickx Claire M
Home Financials for this Owner
Home Financials are based on the most recent Mortgage that was taken out on this home.
Original Mortgage
$126,750
Interest Rate
6.92%
Mortgage Type
Purchase Money Mortgage
Create a Home Valuation Report for This Property
The Home Valuation Report is an in-depth analysis detailing your home's value as well as a comparison with similar homes in the area
Home Values in the Area
Average Home Value in this Area
Purchase History
| Date | Buyer | Sale Price | Title Company |
|---|---|---|---|
| Claire M Noenickx Ret | -- | None Available | |
| Noenickx Claire M | $169,000 | -- |
Source: Public Records
Mortgage History
| Date | Status | Borrower | Loan Amount |
|---|---|---|---|
| Previous Owner | Noenickx Claire M | $126,750 |
Source: Public Records
Tax History Compared to Growth
Tax History
| Year | Tax Paid | Tax Assessment Tax Assessment Total Assessment is a certain percentage of the fair market value that is determined by local assessors to be the total taxable value of land and additions on the property. | Land | Improvement |
|---|---|---|---|---|
| 2025 | $7,249 | $628,700 | $387,000 | $241,700 |
| 2024 | $6,776 | $601,200 | $368,600 | $232,600 |
| 2023 | $6,402 | $575,200 | $351,000 | $224,200 |
| 2022 | $6,111 | $510,100 | $306,400 | $203,700 |
| 2021 | $6,102 | $502,600 | $306,400 | $196,200 |
| 2020 | $5,741 | $461,900 | $278,600 | $183,300 |
| 2019 | $5,850 | $466,100 | $291,200 | $174,900 |
| 2018 | $5,860 | $439,300 | $289,400 | $149,900 |
| 2017 | $4,903 | $346,000 | $209,800 | $136,200 |
| 2016 | $4,585 | $319,300 | $190,700 | $128,600 |
| 2015 | $4,510 | $308,900 | $190,700 | $118,200 |
| 2014 | $4,443 | $299,000 | $190,700 | $108,300 |
Source: Public Records
Map
Nearby Homes
- 22 Winslow Rd
- 15 Huckins Ave
- 153 Bayside Rd
- 2 Parke Ave
- 1 Parke Ave
- 15 Knollwood Rd
- 19 Knollwood Rd
- 63 Crabtree Rd
- 116 Crabtree Rd
- 19 Harbourside Rd Unit 19
- 6 Schooner Ln
- 10 Sloop Ln
- 9 Whaler Ln
- 1001 Marina Dr Unit 801
- 1001 Marina Dr Unit 213
- 1001 Marina Dr Unit 612
- 2001 Marina Dr Unit 506W
- 2001 Marina Dr Unit 211
- 25 Tilden Commons Dr
- 10 Seaport Dr Unit 2311
- 16 Monmouth St
- 50 Standish Rd
- 54 Standish Rd
- 46 Standish Rd
- 66 Bellevue Rd
- 68 Shoreham St
- 36 Standish Rd
- 76 Shoreham St
- 15 Monmouth St
- 17 Monmouth St
- 78 Bellevue Rd
- 43 Standish Rd
- 9 Border St
- 50 Bellevue Rd
- 50 Bellevue Rd Unit 1
- 12 Border St
- 30 Monmouth St
- 25 Monmouth St
- 5 Waumbeck St
- 12 Bayberry Rd