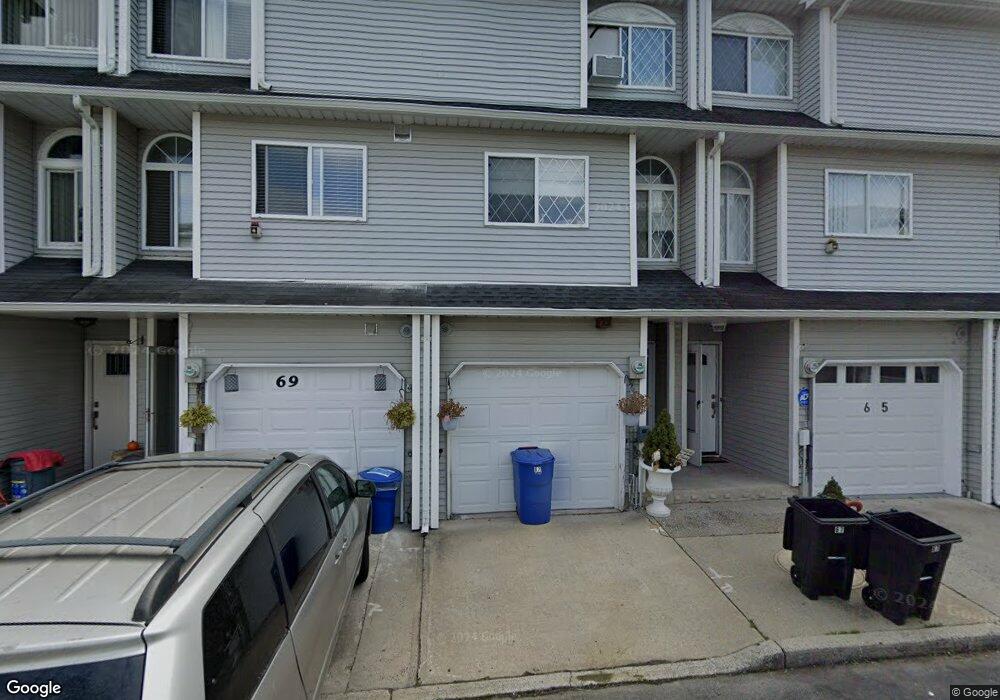
67 Simmons Loop Staten Island, NY 10314
Travis-Chelsea NeighborhoodEstimated Value: $508,000 - $563,000
2
Beds
2
Baths
1,480
Sq Ft
$365/Sq Ft
Est. Value
About This Home
This home is located at 67 Simmons Loop, Staten Island, NY 10314 and is currently estimated at $540,847, approximately $365 per square foot. 67 Simmons Loop is a home located in Richmond County with nearby schools including P.S. 26 The Carteret School, Is 72 Rocco Laurie, and Port Richmond High School.
Ownership History
Date
Name
Owned For
Owner Type
Purchase Details
Closed on
Mar 13, 2014
Sold by
Prentice Stephanie L
Bought by
Farina Christopher
Current Estimated Value
Home Financials for this Owner
Home Financials are based on the most recent Mortgage that was taken out on this home.
Original Mortgage
$176,250
Outstanding Balance
$133,133
Interest Rate
4.25%
Mortgage Type
New Conventional
Estimated Equity
$407,714
Purchase Details
Closed on
Dec 1, 2009
Sold by
Mandart Rosemarie
Bought by
Prentice Stephanie L
Home Financials for this Owner
Home Financials are based on the most recent Mortgage that was taken out on this home.
Original Mortgage
$270,019
Interest Rate
5.25%
Mortgage Type
FHA
Purchase Details
Closed on
Oct 1, 2003
Sold by
Zacchino Anthony C
Bought by
Mandart Rosemarie
Home Financials for this Owner
Home Financials are based on the most recent Mortgage that was taken out on this home.
Original Mortgage
$220,000
Interest Rate
5.88%
Mortgage Type
Purchase Money Mortgage
Create a Home Valuation Report for This Property
The Home Valuation Report is an in-depth analysis detailing your home's value as well as a comparison with similar homes in the area
Home Values in the Area
Average Home Value in this Area
Purchase History
| Date | Buyer | Sale Price | Title Company |
|---|---|---|---|
| Farina Christopher | $235,000 | None Available | |
| Prentice Stephanie L | $275,000 | First Amer Title Ins Co Ny | |
| Mandart Rosemarie | $230,000 | -- |
Source: Public Records
Mortgage History
| Date | Status | Borrower | Loan Amount |
|---|---|---|---|
| Open | Farina Christopher | $176,250 | |
| Previous Owner | Prentice Stephanie L | $270,019 | |
| Previous Owner | Mandart Rosemarie | $220,000 |
Source: Public Records
Tax History Compared to Growth
Tax History
| Year | Tax Paid | Tax Assessment Tax Assessment Total Assessment is a certain percentage of the fair market value that is determined by local assessors to be the total taxable value of land and additions on the property. | Land | Improvement |
|---|---|---|---|---|
| 2025 | $4,923 | $34,080 | $3,705 | $30,375 |
| 2024 | $4,923 | $29,280 | $4,219 | $25,061 |
| 2023 | $4,696 | $23,124 | $3,801 | $19,323 |
| 2022 | $4,355 | $27,360 | $5,040 | $22,320 |
| 2021 | $4,394 | $25,500 | $5,040 | $20,460 |
| 2020 | $4,420 | $22,440 | $5,040 | $17,400 |
| 2019 | $4,273 | $23,340 | $5,040 | $18,300 |
| 2018 | $3,928 | $19,270 | $4,875 | $14,395 |
| 2017 | $3,706 | $18,180 | $5,040 | $13,140 |
| 2016 | $3,478 | $17,400 | $5,040 | $12,360 |
| 2015 | $3,393 | $17,880 | $4,320 | $13,560 |
| 2014 | $3,393 | $17,680 | $4,272 | $13,408 |
Source: Public Records
Map
Nearby Homes
- 65 Simmons Loop Unit Building
- 63 Simmons Loop
- 69 Simmons Loop
- 61 Simmons Loop
- 71 Simmons Loop
- 73 Simmons Loop
- 75 Simmons Loop
- 53 Simmons Loop
- 55 Simmons Loop
- 77 Simmons Loop
- 74 Simmons Loop
- 79 Towers Ln
- 79 Simmons Loop
- 81 Towers Ln
- 75 Towers Ln
- 51 Simmons Loop
- 76 Simmons Loop
- 73 Towers Ln
- 81 Simmons Loop