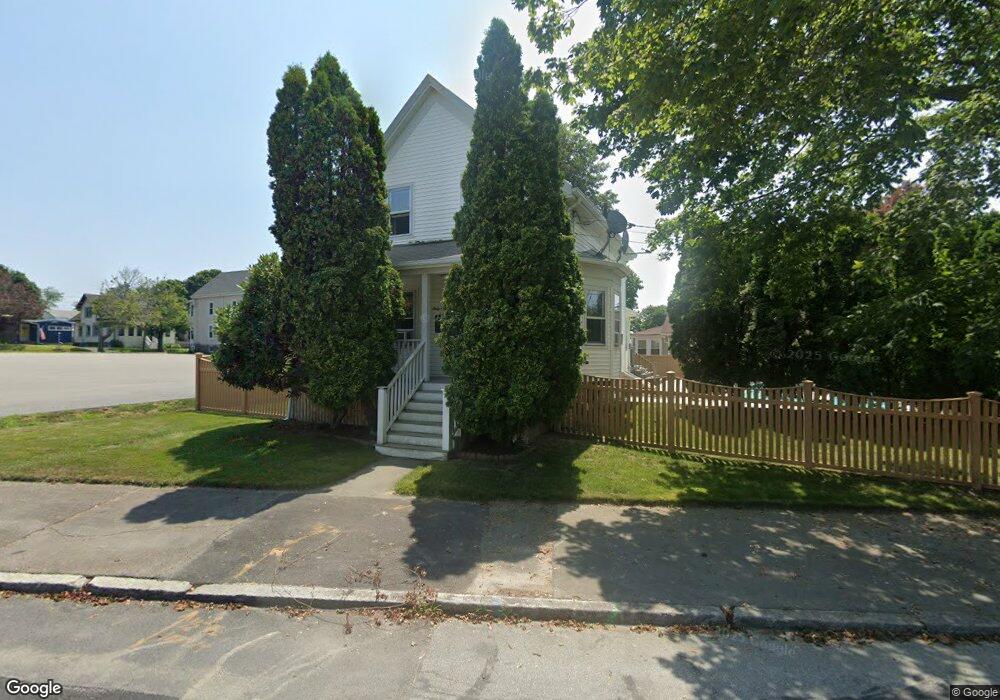
67 Spring St Fairhaven, MA 02719
Estimated Value: $436,000 - $491,000
4
Beds
1
Bath
1,242
Sq Ft
$376/Sq Ft
Est. Value
About This Home
This home is located at 67 Spring St, Fairhaven, MA 02719 and is currently estimated at $467,208, approximately $376 per square foot. 67 Spring St is a home located in Bristol County with nearby schools including Fairhaven High School, City On A Hill Charter Public School New Bedford, and St. Joseph School.
Ownership History
Date
Name
Owned For
Owner Type
Purchase Details
Closed on
Mar 26, 1993
Sold by
Pothier Paul L and Pothier Nancy W
Bought by
Dionne Bruce S and Dionne Karen P
Current Estimated Value
Home Financials for this Owner
Home Financials are based on the most recent Mortgage that was taken out on this home.
Original Mortgage
$105,000
Interest Rate
7.73%
Mortgage Type
Purchase Money Mortgage
Create a Home Valuation Report for This Property
The Home Valuation Report is an in-depth analysis detailing your home's value as well as a comparison with similar homes in the area
Home Values in the Area
Average Home Value in this Area
Purchase History
| Date | Buyer | Sale Price | Title Company |
|---|---|---|---|
| Dionne Bruce S | $115,000 | -- |
Source: Public Records
Mortgage History
| Date | Status | Borrower | Loan Amount |
|---|---|---|---|
| Open | Dionne Bruce S | $152,000 | |
| Closed | Dionne Bruce S | $187,000 | |
| Closed | Dionne Bruce S | $20,000 | |
| Closed | Dionne Bruce S | $105,000 |
Source: Public Records
Tax History Compared to Growth
Tax History
| Year | Tax Paid | Tax Assessment Tax Assessment Total Assessment is a certain percentage of the fair market value that is determined by local assessors to be the total taxable value of land and additions on the property. | Land | Improvement |
|---|---|---|---|---|
| 2025 | $35 | $375,300 | $172,000 | $203,300 |
| 2024 | $3,368 | $364,900 | $172,000 | $192,900 |
| 2023 | $3,299 | $331,600 | $150,600 | $181,000 |
| 2022 | $3,204 | $313,500 | $140,000 | $173,500 |
| 2021 | $3,084 | $273,200 | $126,600 | $146,600 |
| 2020 | $3,124 | $273,200 | $126,600 | $146,600 |
| 2019 | $2,802 | $240,100 | $105,000 | $135,100 |
| 2018 | $2,694 | $229,300 | $100,000 | $129,300 |
| 2017 | $2,669 | $221,700 | $100,000 | $121,700 |
| 2016 | $2,577 | $211,600 | $100,000 | $111,600 |
| 2015 | $2,549 | $209,800 | $100,000 | $109,800 |
Source: Public Records
Map
Nearby Homes