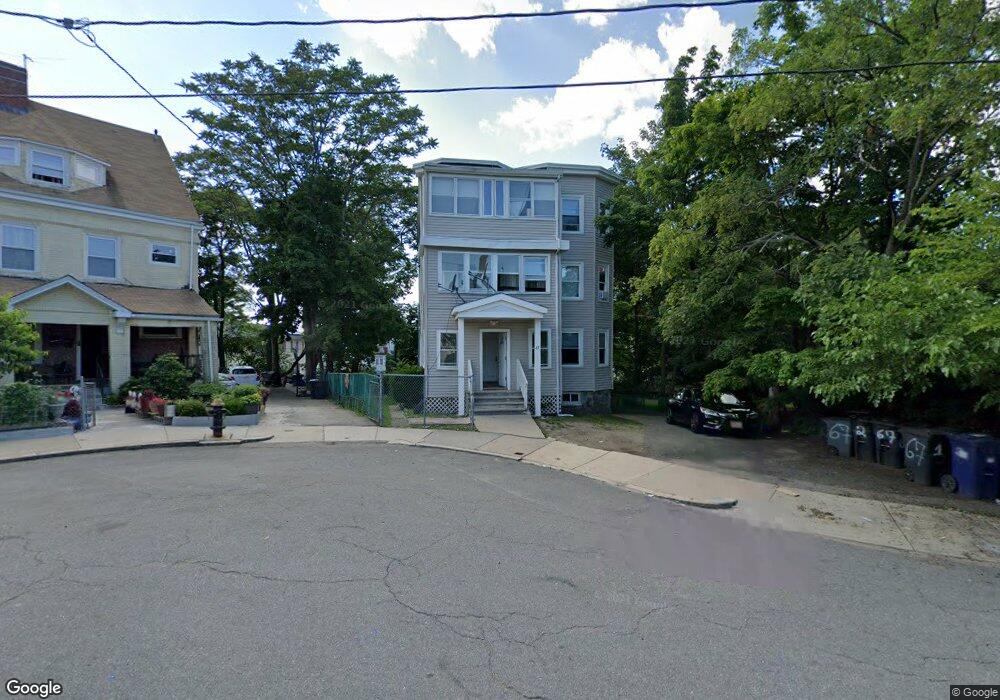
67 Stanley St Dorchester, MA 02125
Bowdoin North-Mount Bowdoin NeighborhoodEstimated Value: $1,069,000 - $1,184,845
11
Beds
3
Baths
3,738
Sq Ft
$307/Sq Ft
Est. Value
About This Home
This home is located at 67 Stanley St, Dorchester, MA 02125 and is currently estimated at $1,145,711, approximately $306 per square foot. 67 Stanley St is a home located in Suffolk County with nearby schools including Uncommon Schools Roxbury Prep Dorchester Campus.
Ownership History
Date
Name
Owned For
Owner Type
Purchase Details
Closed on
Jul 2, 2009
Sold by
Oshea David F
Bought by
Collins Timothy M
Current Estimated Value
Home Financials for this Owner
Home Financials are based on the most recent Mortgage that was taken out on this home.
Original Mortgage
$236,250
Outstanding Balance
$149,348
Interest Rate
4.86%
Mortgage Type
Purchase Money Mortgage
Estimated Equity
$996,363
Purchase Details
Closed on
Apr 22, 2008
Sold by
Citibank Na
Bought by
Oshea David F
Purchase Details
Closed on
Nov 30, 2007
Sold by
Alce Degnol and Citibank Na
Bought by
Citibank Na
Purchase Details
Closed on
May 5, 2006
Sold by
Desauguste Sagyn
Bought by
Alce Degnol and Erilus Pierre
Purchase Details
Closed on
Nov 1, 2004
Sold by
Leblanc Sagyn and Desauguste Sagyn
Bought by
Sainvil Elta
Purchase Details
Closed on
Aug 25, 1998
Sold by
Thomas Torrance W
Bought by
Leblanc Sagyn
Purchase Details
Closed on
Apr 22, 1997
Sold by
Dime Sb Ny
Bought by
Thomas Torrence W
Purchase Details
Closed on
Aug 7, 1996
Sold by
Bernard Rasheeda and Dime Sb Of Ny
Bought by
Dime Sb Ny
Create a Home Valuation Report for This Property
The Home Valuation Report is an in-depth analysis detailing your home's value as well as a comparison with similar homes in the area
Home Values in the Area
Average Home Value in this Area
Purchase History
| Date | Buyer | Sale Price | Title Company |
|---|---|---|---|
| Collins Timothy M | $315,000 | -- | |
| Collins Timothy M | $315,000 | -- | |
| Oshea David F | $240,000 | -- | |
| Oshea David F | $240,000 | -- | |
| Citibank Na | $340,900 | -- | |
| Citibank Na | $340,900 | -- | |
| Alce Degnol | $571,400 | -- | |
| Alce Degnol | $571,400 | -- | |
| Sainvil Elta | -- | -- | |
| Sainvil Elta | -- | -- | |
| Leblanc Sagyn | $158,000 | -- | |
| Leblanc Sagyn | $158,000 | -- | |
| Thomas Torrence W | $86,000 | -- | |
| Thomas Torrence W | $86,000 | -- | |
| Dime Sb Ny | $67,300 | -- | |
| Dime Sb Ny | $67,300 | -- |
Source: Public Records
Mortgage History
| Date | Status | Borrower | Loan Amount |
|---|---|---|---|
| Open | Collins Timothy M | $236,250 | |
| Closed | Dime Sb Ny | $236,250 |
Source: Public Records
Tax History Compared to Growth
Tax History
| Year | Tax Paid | Tax Assessment Tax Assessment Total Assessment is a certain percentage of the fair market value that is determined by local assessors to be the total taxable value of land and additions on the property. | Land | Improvement |
|---|---|---|---|---|
| 2025 | $13,673 | $1,180,700 | $317,700 | $863,000 |
| 2024 | $11,969 | $1,098,100 | $272,700 | $825,400 |
| 2023 | $10,821 | $1,007,500 | $250,200 | $757,300 |
| 2022 | $10,343 | $950,600 | $236,000 | $714,600 |
| 2021 | $9,479 | $888,400 | $220,600 | $667,800 |
| 2020 | $7,456 | $706,100 | $213,500 | $492,600 |
| 2019 | $6,948 | $659,200 | $166,000 | $493,200 |
| 2018 | $6,279 | $599,100 | $166,000 | $433,100 |
| 2017 | $5,927 | $559,700 | $166,000 | $393,700 |
| 2016 | $5,701 | $518,300 | $166,000 | $352,300 |
| 2015 | $5,166 | $426,600 | $152,200 | $274,400 |
| 2014 | $4,826 | $383,600 | $152,200 | $231,400 |
Source: Public Records
Map
Nearby Homes
- 60 Stanley St Unit 301
- 60 Stanley St Unit 302
- 60 Stanley St
- 60 Stanley St Unit 101
- 76 Bellevue St
- 70 Hamilton St
- 52 Bellevue St Unit 1
- 52 Bellevue St Unit 3
- 52 Bellevue St Unit 2
- 51 Hamilton St Unit 3
- 70-72 Clarkson St
- 35-37 Clarkson St
- 22 Ronan St
- 3 Ware St
- 1 Rock Terrace Unit 1
- 1 Rock Terrace Unit 3
- 252-254 Magnolia St
- 19 Mount Ida Rd
- 1 Dever St
- 20 Rill St
- 67 Stanley St
- 67 Stanley St Unit 3
- 67 Stanley St Unit 2
- 71 Stanley St
- 48 Mount Everett St
- 48 Mount Everett St Unit 1
- 54 Mount Everett St
- 46 Mount Everett St
- 68 Stanley St
- 46 Hamilton St
- 44 Mount Everett St
- 70 Stanley St
- 60 Stanley St Unit 102
- 60 Stanley St Unit 102
- 60 Stanley St Unit 203
- 56 Hamilton St
- 46 Hamilton St
- 34 Mount Everett St Unit 3
- 34 Mount Everett St Unit 2
- 34 Mount Everett St Unit 1