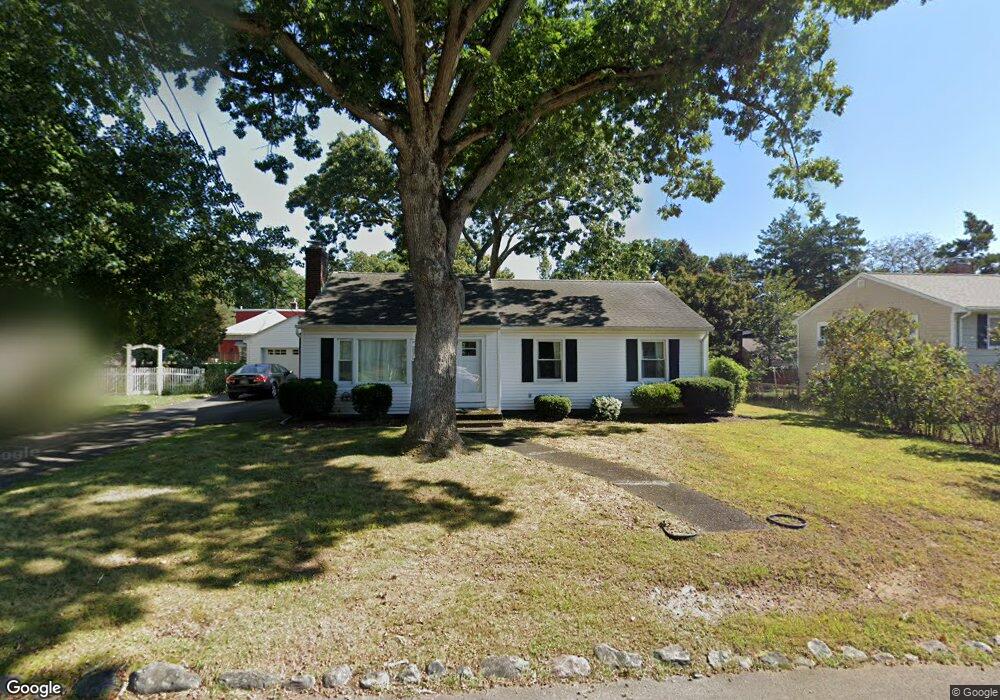
67 Sycamore Ave Attleboro, MA 02703
Estimated Value: $443,000 - $477,000
3
Beds
1
Bath
1,286
Sq Ft
$357/Sq Ft
Est. Value
About This Home
This home is located at 67 Sycamore Ave, Attleboro, MA 02703 and is currently estimated at $458,964, approximately $356 per square foot. 67 Sycamore Ave is a home located in Bristol County with nearby schools including Hill-Roberts Elementary School, Robert J. Coelho Middle School, and Attleboro High School.
Ownership History
Date
Name
Owned For
Owner Type
Purchase Details
Closed on
Feb 17, 2010
Sold by
Ovoian Philip and Ovoian Rose
Bought by
Vignali Andrew J
Current Estimated Value
Home Financials for this Owner
Home Financials are based on the most recent Mortgage that was taken out on this home.
Original Mortgage
$200,000
Outstanding Balance
$133,290
Interest Rate
5.17%
Mortgage Type
Purchase Money Mortgage
Estimated Equity
$325,674
Create a Home Valuation Report for This Property
The Home Valuation Report is an in-depth analysis detailing your home's value as well as a comparison with similar homes in the area
Home Values in the Area
Average Home Value in this Area
Purchase History
| Date | Buyer | Sale Price | Title Company |
|---|---|---|---|
| Vignali Andrew J | $230,000 | -- |
Source: Public Records
Mortgage History
| Date | Status | Borrower | Loan Amount |
|---|---|---|---|
| Open | Vignali Andrew J | $200,000 |
Source: Public Records
Tax History
| Year | Tax Paid | Tax Assessment Tax Assessment Total Assessment is a certain percentage of the fair market value that is determined by local assessors to be the total taxable value of land and additions on the property. | Land | Improvement |
|---|---|---|---|---|
| 2025 | $4,276 | $340,700 | $124,800 | $215,900 |
| 2024 | $4,147 | $325,800 | $124,800 | $201,000 |
| 2023 | $3,948 | $288,400 | $113,400 | $175,000 |
| 2022 | $3,810 | $263,700 | $108,100 | $155,600 |
| 2021 | $3,543 | $239,400 | $103,900 | $135,500 |
| 2020 | $3,443 | $236,500 | $100,900 | $135,600 |
| 2019 | $3,294 | $232,600 | $98,900 | $133,700 |
| 2018 | $3,235 | $218,300 | $96,000 | $122,300 |
| 2017 | $3,018 | $207,400 | $96,000 | $111,400 |
| 2016 | $2,882 | $194,500 | $94,200 | $100,300 |
| 2015 | $2,880 | $195,800 | $94,200 | $101,600 |
| 2014 | $2,700 | $181,800 | $89,800 | $92,000 |
Source: Public Records
Map
Nearby Homes
- 23 Magnolia St Unit 2
- 44 Buffington St
- 0 Mckay St
- 856 Newport Ave
- 82 Belair Ave
- 195 Brown St
- 39 Slade Ave
- 0 Alfred St
- 47 Castle Rd
- 0 Adamsdale Rd
- 500 Mendon Rd Unit 257
- 6 Castle Rd
- 18 Cumberland St
- 511 Mendon Rd Unit 511
- 509 Mendon Rd Unit 509
- 171 Mendon Rd
- 54 Baltic St Unit 54
- 52 Baltic St Unit 52
- 58 Baltic St Unit 58
- 56 Baltic St Unit 56